Registration Open
Registration Open
01 September | 04:00
-
Reset your password
We'll email you instructions on how to reset your password
Take on the Credit Risk Challenge: analyze loan data, spot default trends, and find the right balance between risk and opportunity across USA, UK, and Canada
Workshop | Workshop on Using Power BI for Credit Risk Analytics in Banking
Workshop | Workshop on Using Power BI for Credit Risk Analytics in Banking
16 September | 08:00
-
Entry Submission Deadline
Entry Submission Deadline
24 September | 17:59
01 September - 24 September
Webinar | Top 5 Power BI Reports for Credit Risk Analytics in Banking
Webinar | Top 5 Power BI Reports for Credit Risk Analytics in Banking
26 September | 08:00
01 September - 24 September
🏆 Main Prize: $300 Amazon Gift Card
ZoomCharts Mini Challenge is part of the global DataDNA – Dataset Challenge by Onyx Data, which unites 25K+ data enthusiasts worldwide, ranging from beginners to seasoned professionals, including Microsoft MVPs. Read more about the DataDNA challenge on the Onyx Data DataDNA website. Join the community on LinkedIn.
Why join ZoomCharts Mini Challenge?
🏆 Prize:
The creator of the best report submitted to the Mini Challenge will receive a $300 Amazon gift card. The ZoomCharts winner will be announced in a special live webinar session on September 26, where we will review the Top 5 entries from the challenge.
1. Register for the challenge:
2. Build your report in Power BI:
3. Improve your report and learn new skills:
4. Submit your challenge entry:
If your submission doesn’t match the challenge criteria, you will be notified by email indicating the reason. Don't worry if this happens! You can fix the issue and resubmit your report.
Note: Feel free to resubmit your entry as many times as necessary before the deadline.
5. Finalize your participation to compete for the prize
6. Attend challenge closing webinar to hear the results:
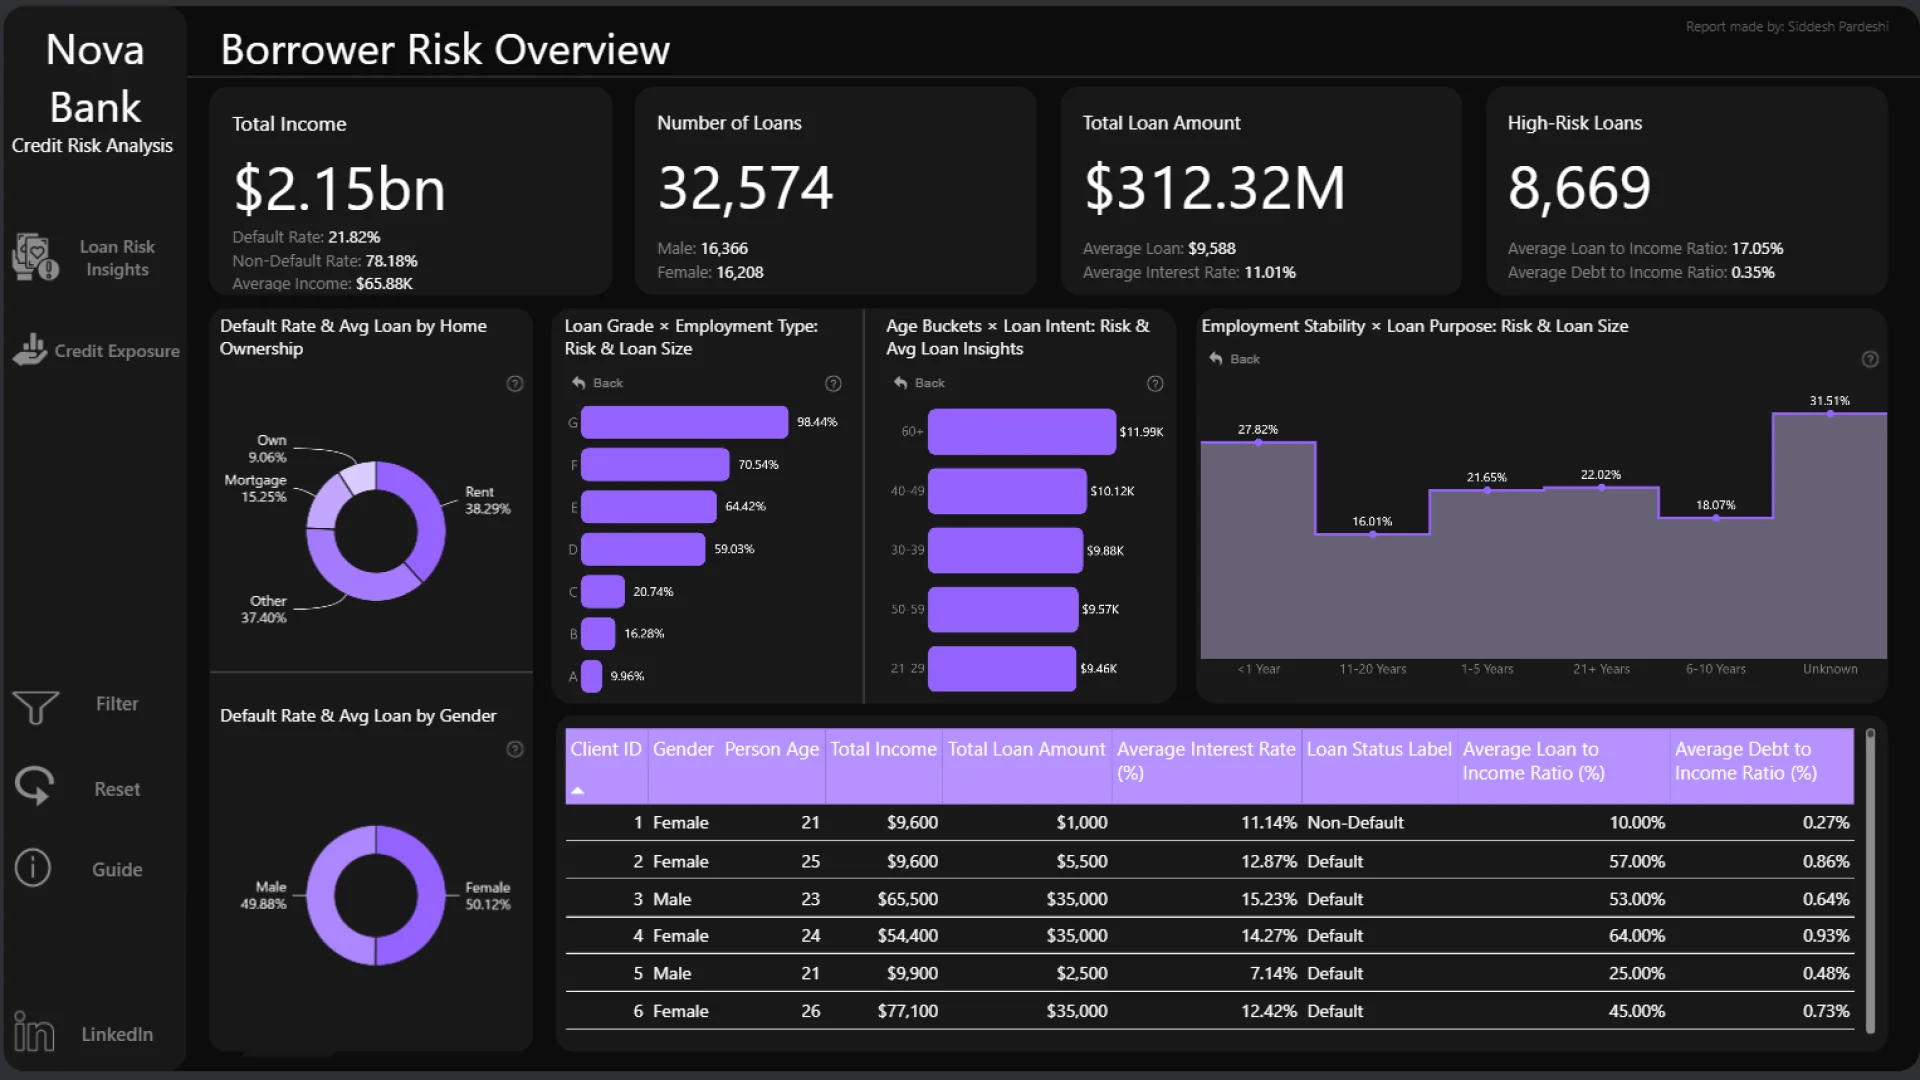
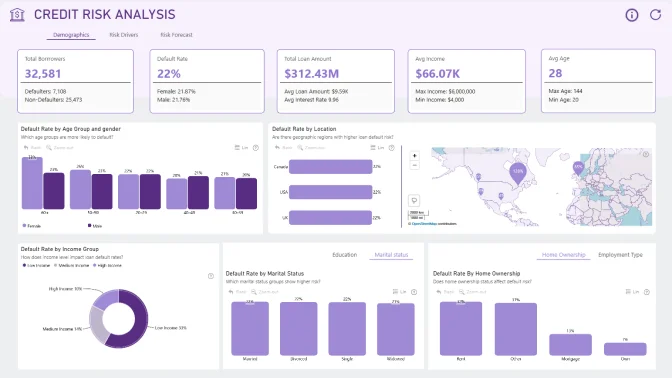
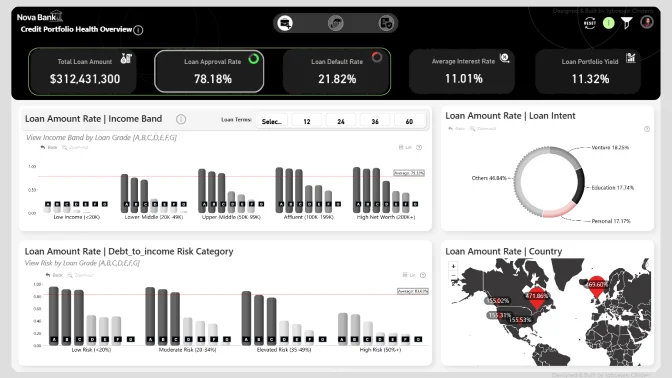
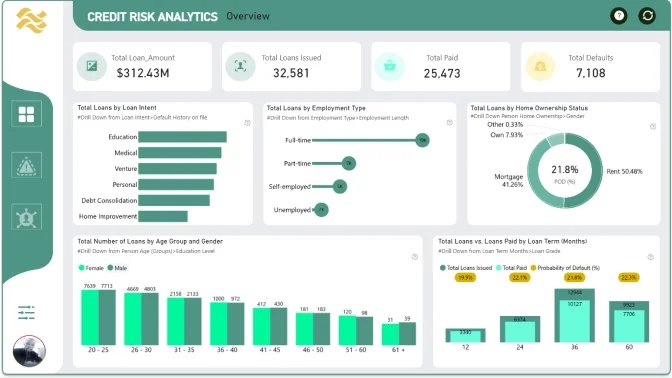
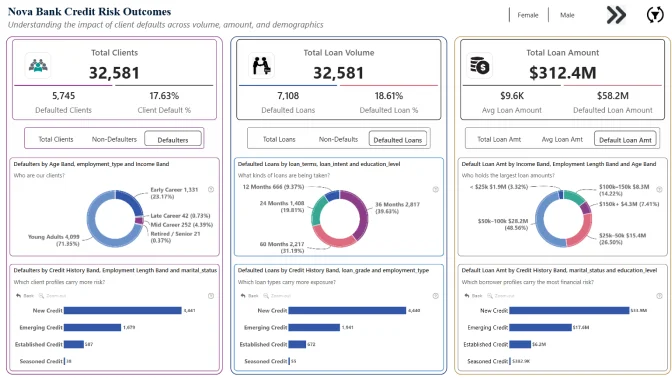
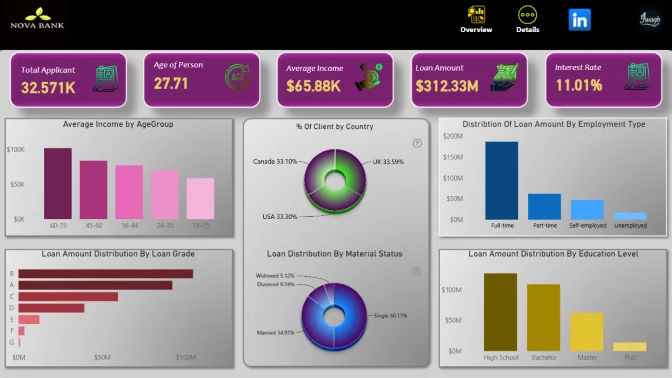
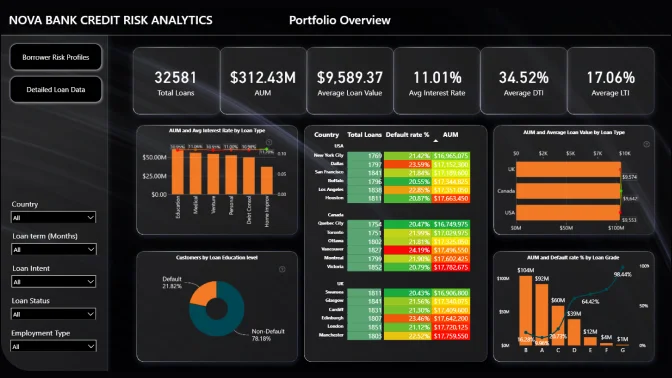
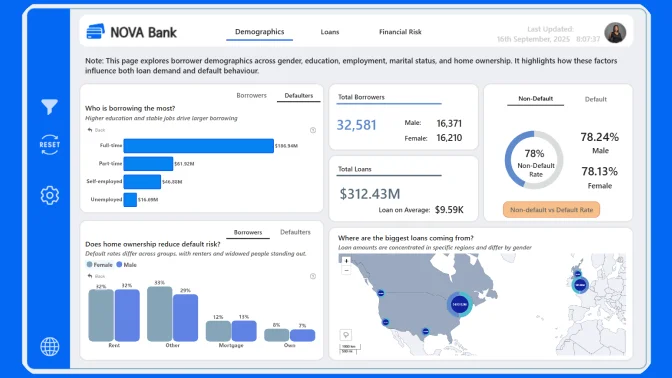
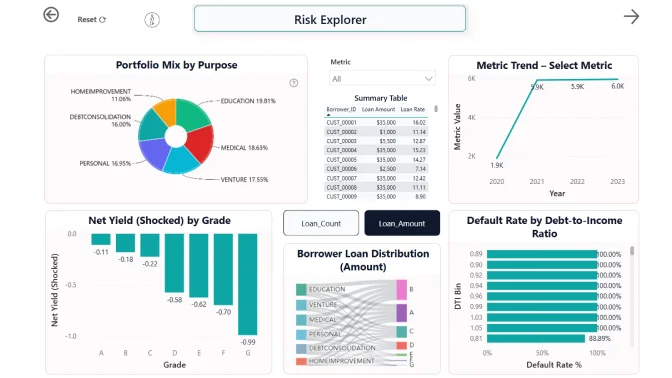
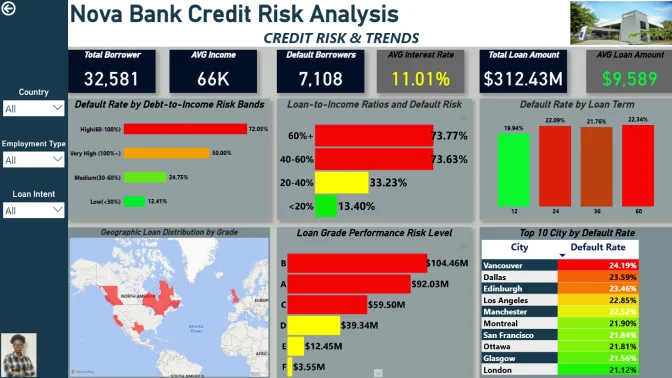
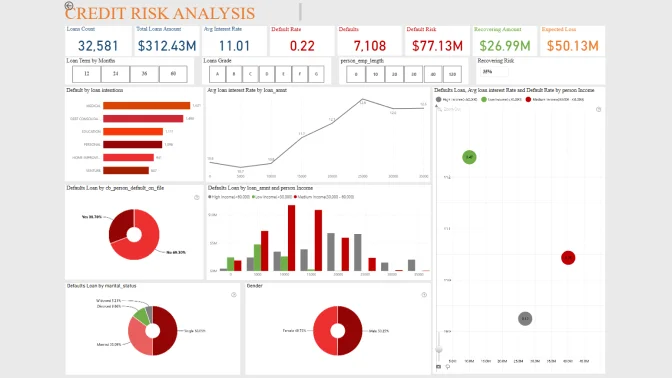
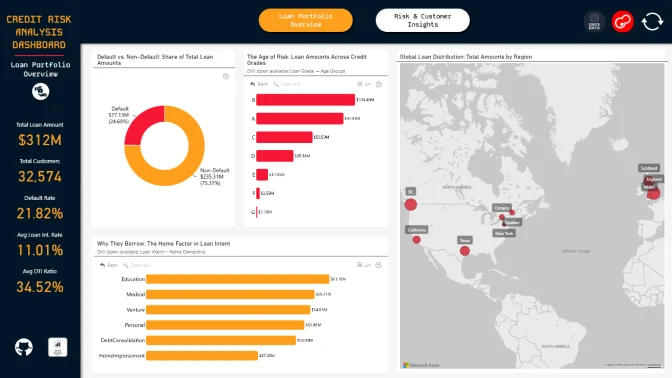
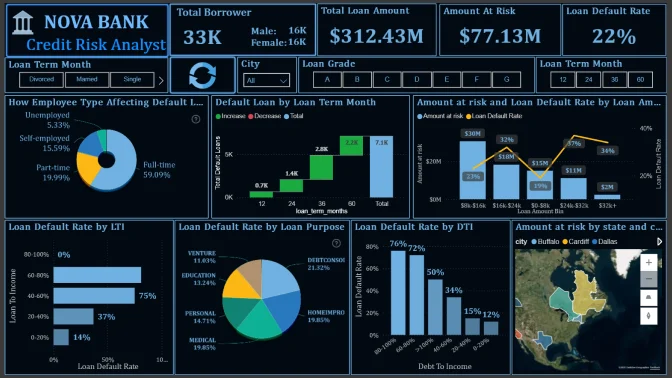
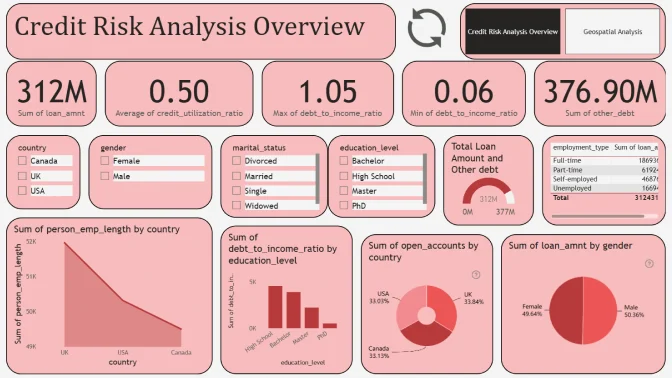
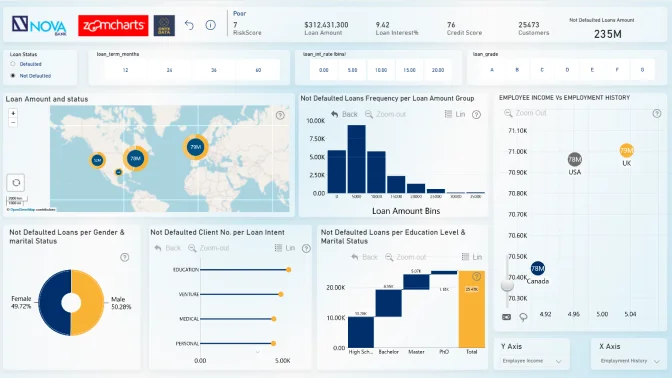
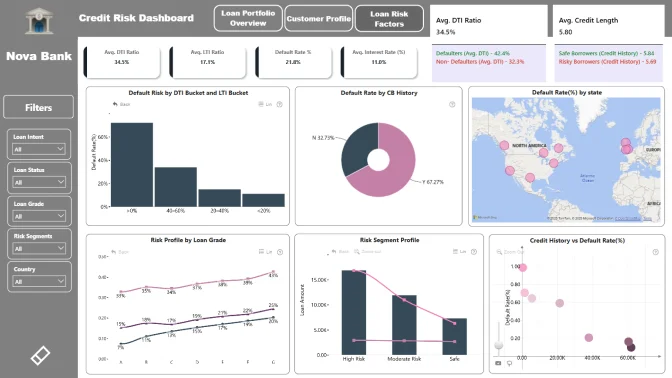
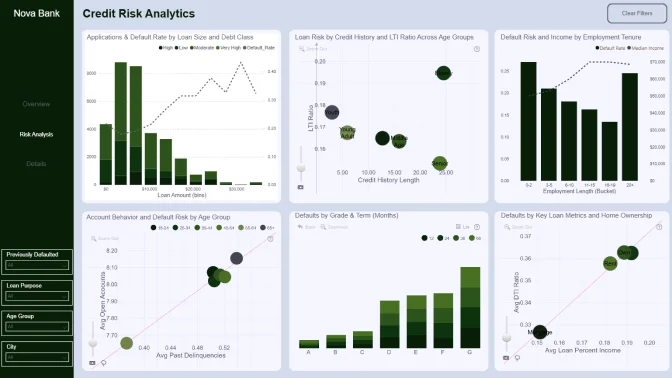
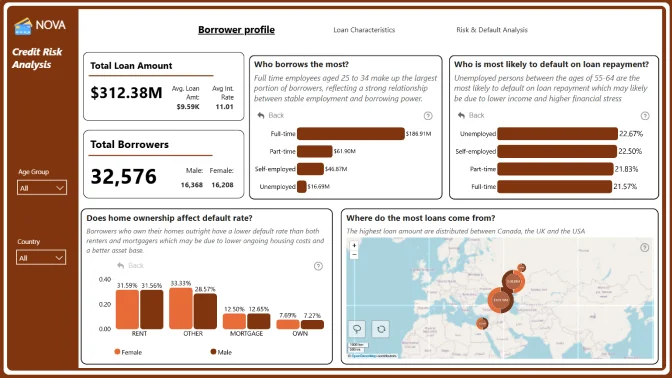
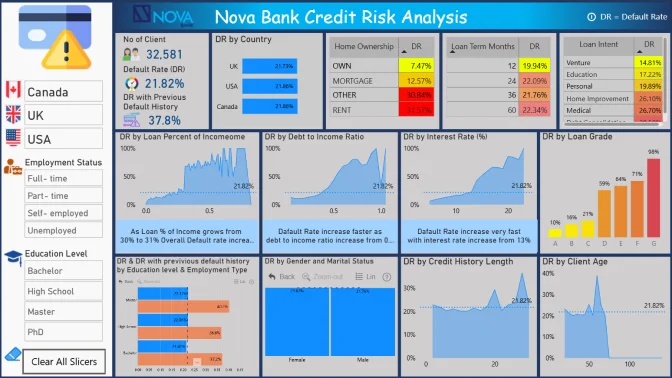
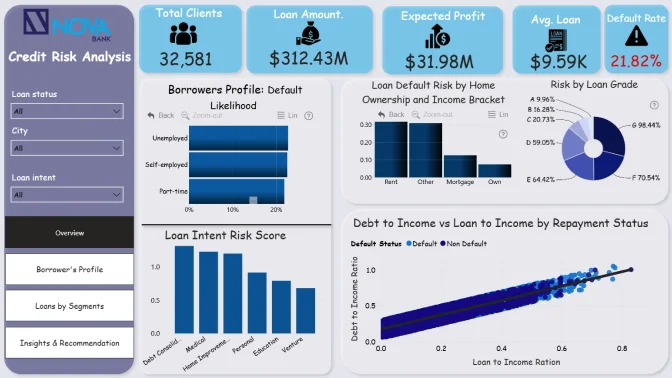
Credit Risk Analytics Challenge
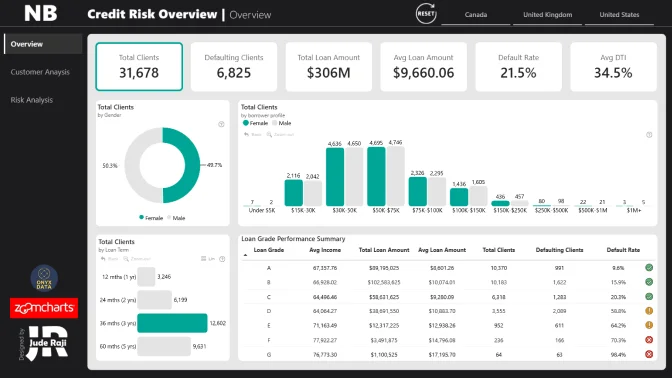
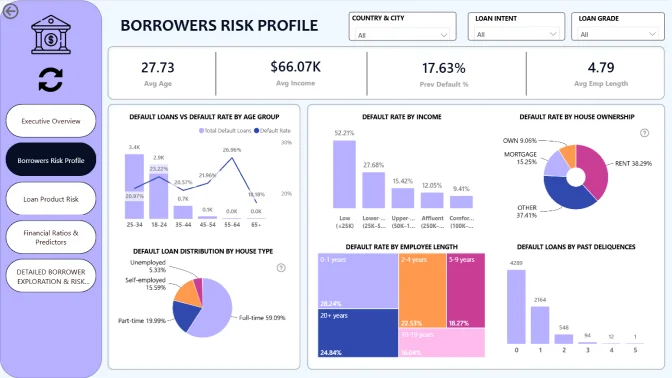
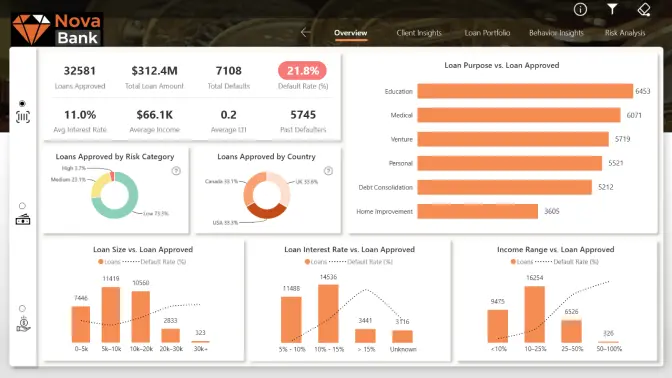
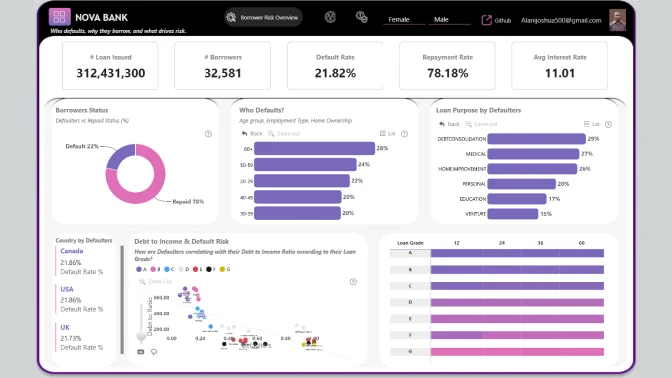
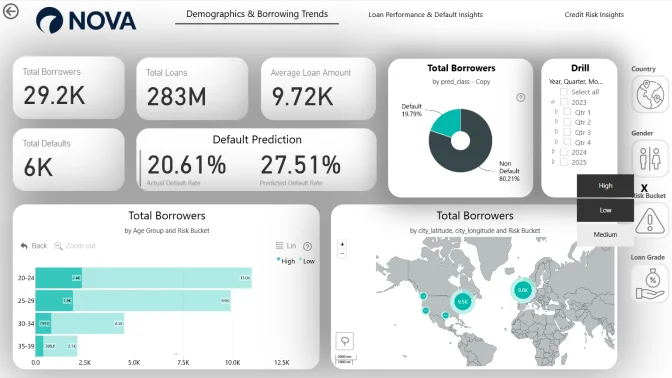
In this challenge, you’ll act as a credit risk analyst at Nova Bank, a financial institution that provides personal, medical, education, and business loans across the USA, UK, and Canada. Nova Bank wants to make lending fair and accessible while also protecting itself from unnecessary risk.
The main challenge is finding the right balance. If Nova Bank approves too many high-risk loans, it loses money. If it becomes too strict, it misses out on potential customers. By looking at the data, your job is to help the bank understand who tends to default and why, and how lending decisions can be made more reliable.
Use the dataset to build a short analysis or dashboard that helps Nova Bank:
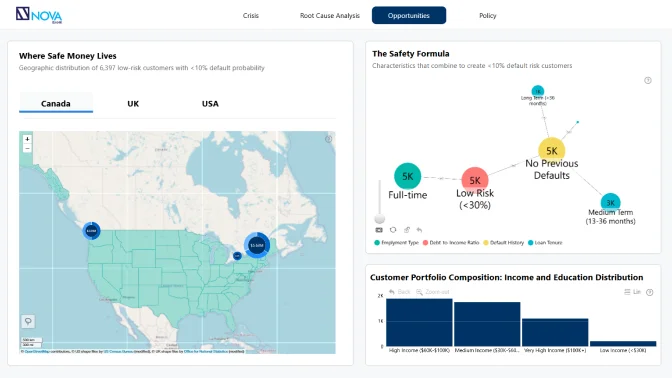
See which groups of borrowers are more or less likely to default
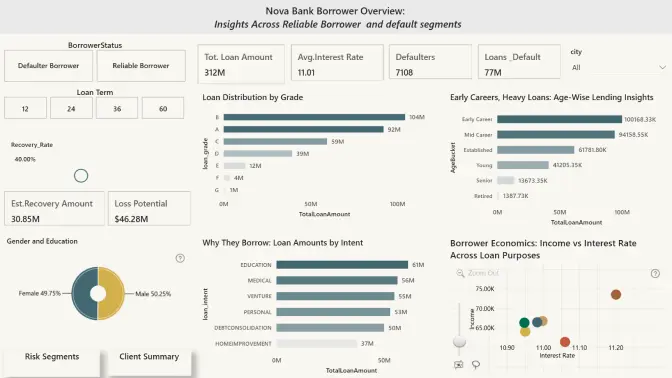
Identify the factors that matter most when predicting loan outcomes
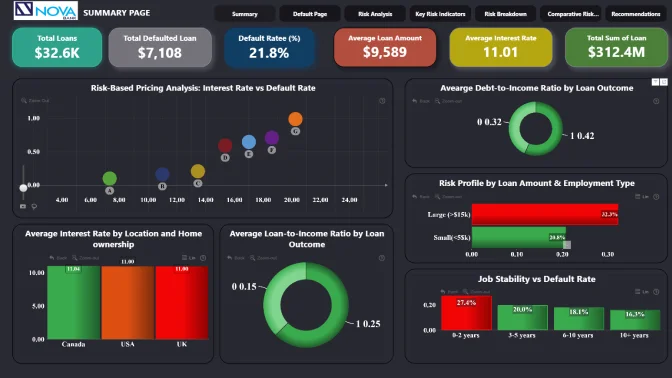
Explore how loan size, income, interest rates, and repayment terms affect risk
Spot early signs of financial trouble so action can be taken sooner
Suggest ways the bank can adjust lending policies to be both safer and fairer
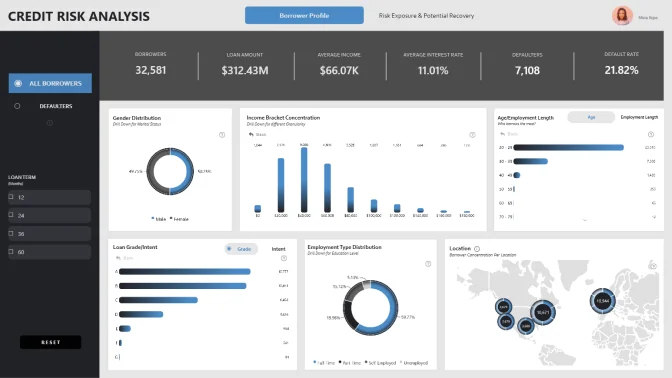
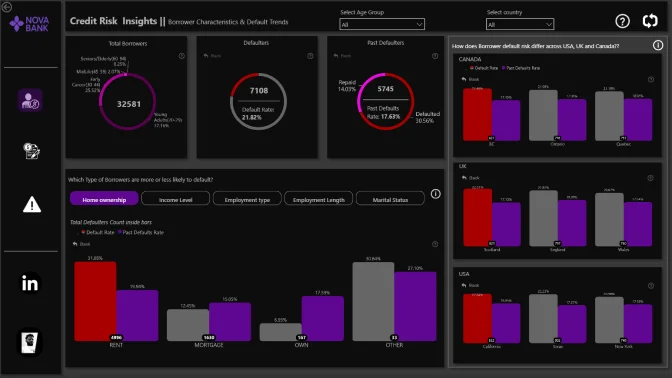
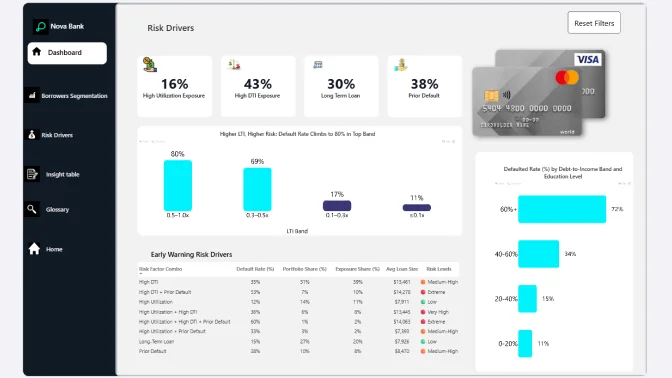
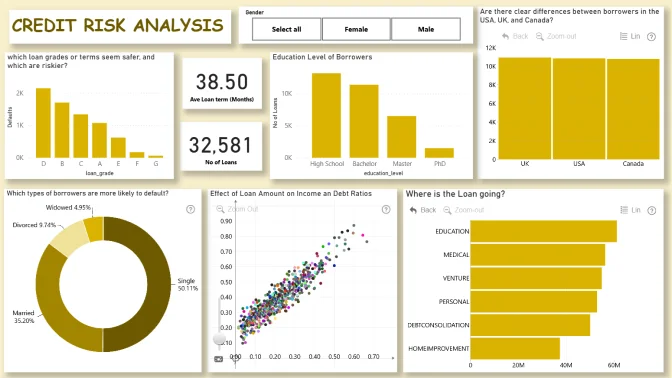
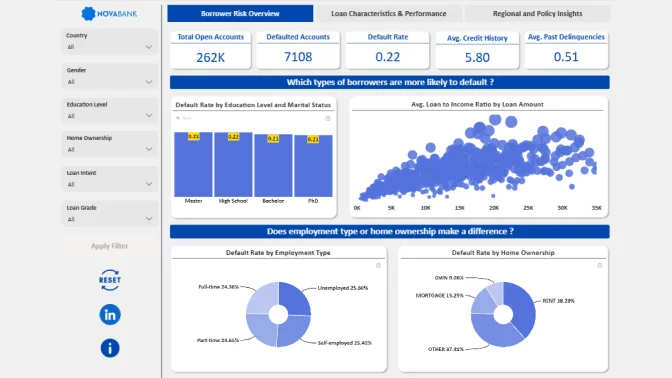
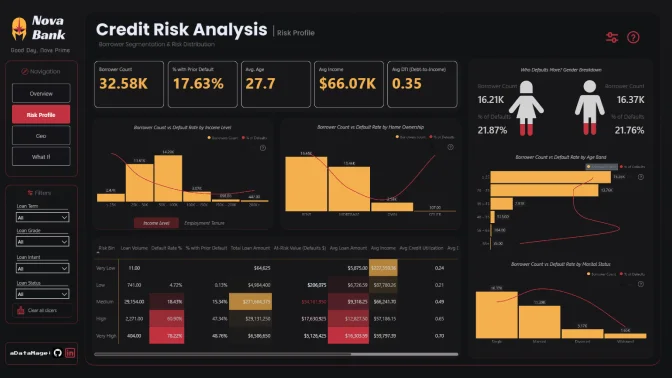
Which types of borrowers are more likely to default?
Do certain loan purposes (education, medical, personal, debt consolidation) carry more risk?
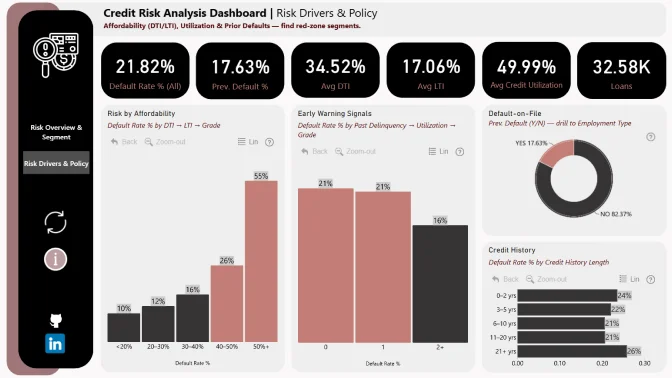
How do loan-to-income and debt-to-income ratios relate to repayment?
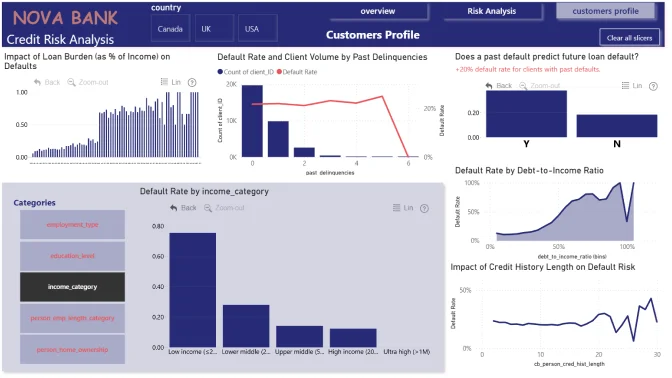
Does employment type or home ownership make a difference?
How do past defaults or longer credit histories affect loan outcomes?
Are there clear differences between borrowers in the USA, UK, and Canada?
Which loan grades or terms seem safer, and which are riskier?
Can groups of borrowers be identified that look “safe” versus “risky”?
✨ Note: These questions are just starting points. You’re encouraged to explore the data in your own way and share any unexpected findings that could help Nova Bank lend more responsibly.
Each report is evaluated based on three main criteria: intuitiveness, insightfulness, and interactivity. These factors ensure that the reports are not only accurate and functional, but also meet the target audience's needs and are ready to be presented to the end-users.
Workshop | Workshop on Using Power BI for Credit Risk Analytics in Banking
Workshop | Workshop on Using Power BI for Credit Risk Analytics in Banking
16 September | 08:00
-
Entry Submission Deadline
Entry Submission Deadline
24 September | 17:59
01 September - 24 September
Webinar | Top 5 Power BI Reports for Credit Risk Analytics in Banking
Webinar | Top 5 Power BI Reports for Credit Risk Analytics in Banking
26 September | 08:00
01 September - 24 September