Registration Open
Registration Open
05 January | 03:00
-
Reset your password
We'll email you instructions on how to reset your password
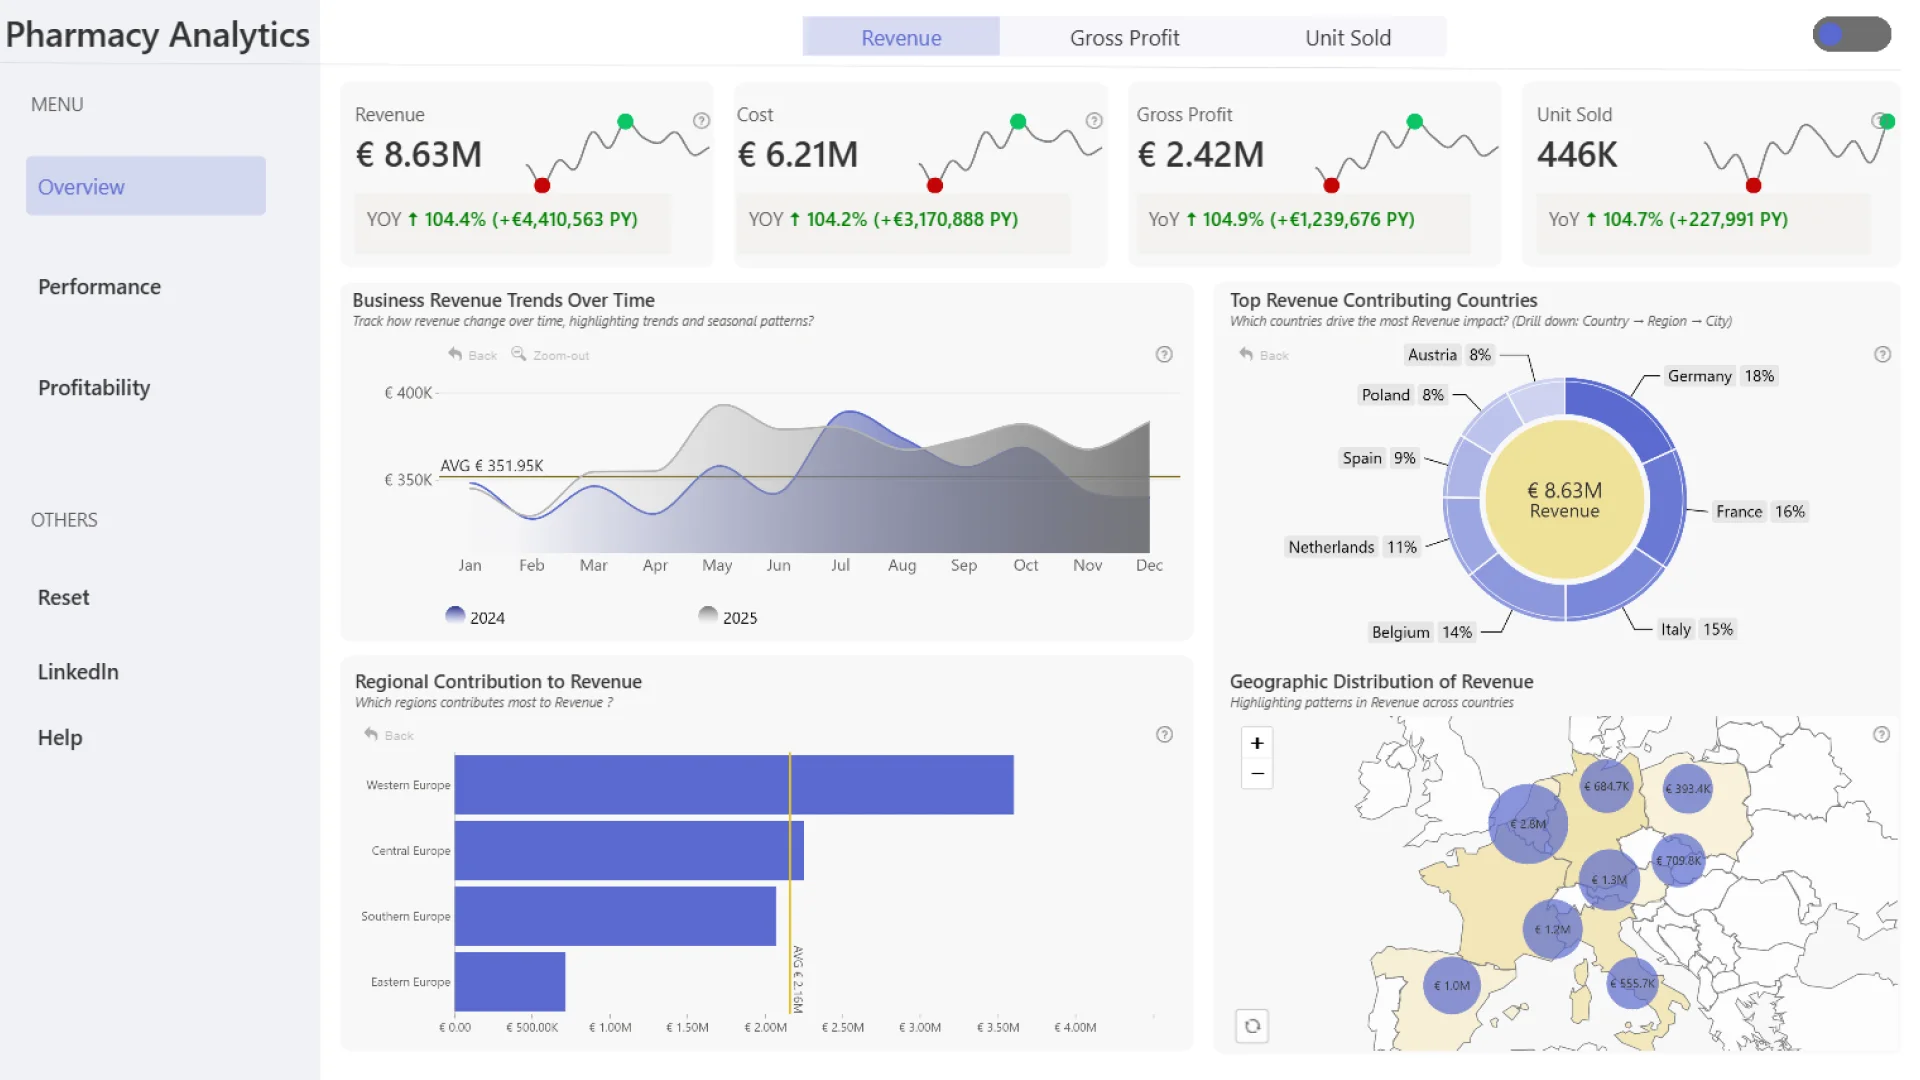
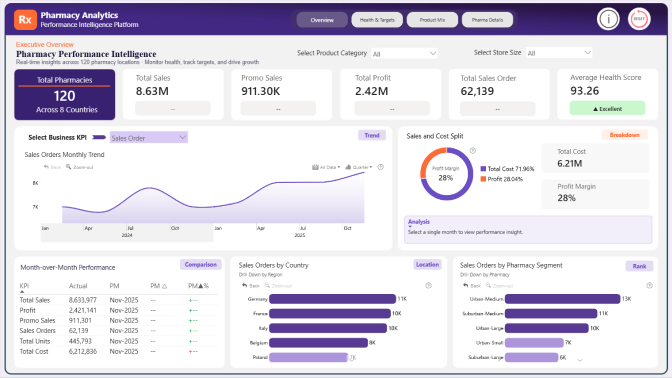
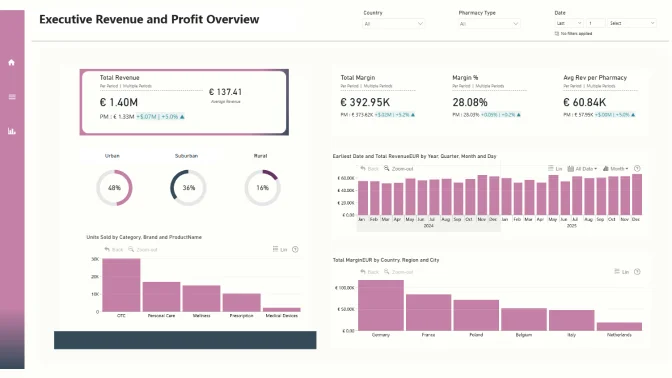
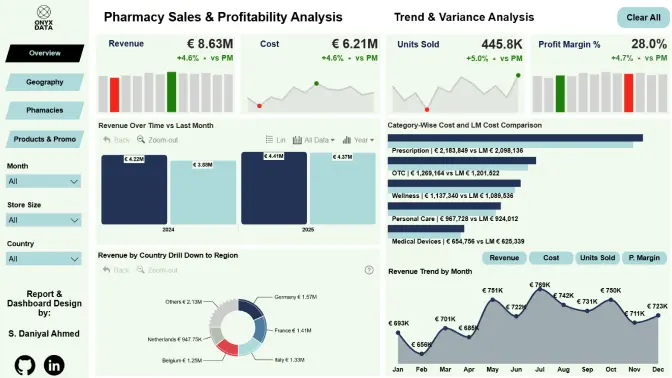
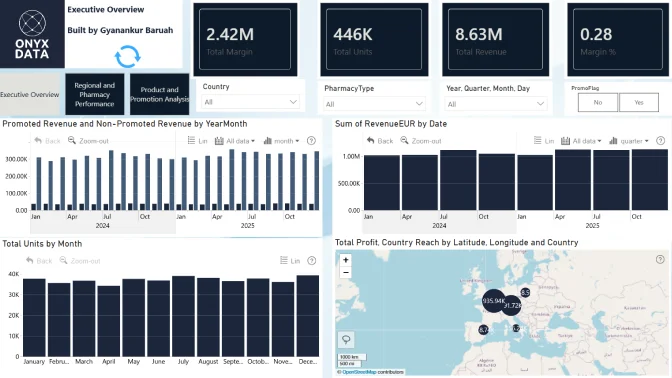
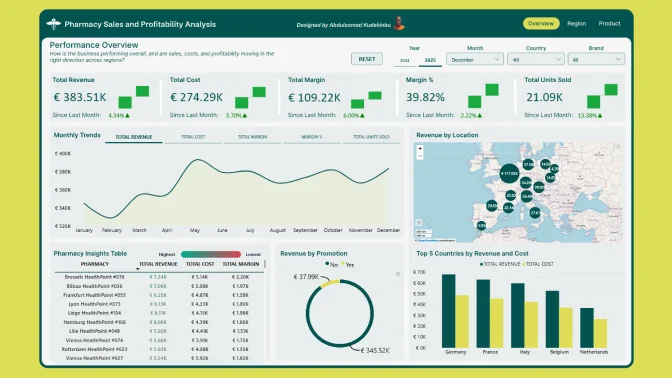
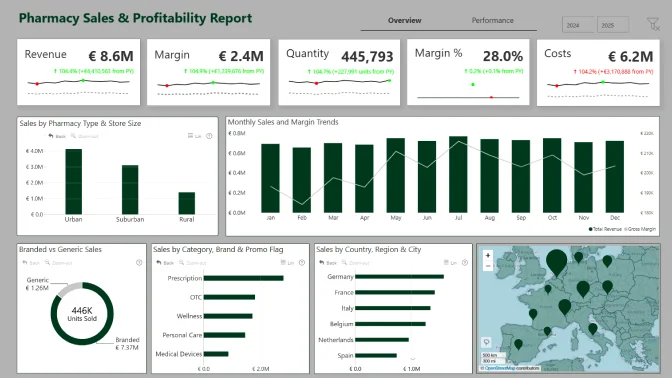
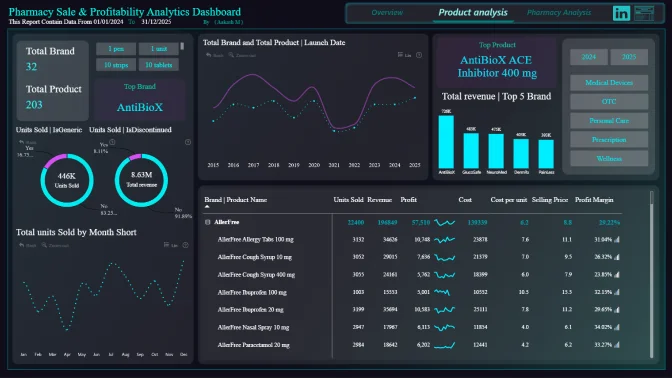
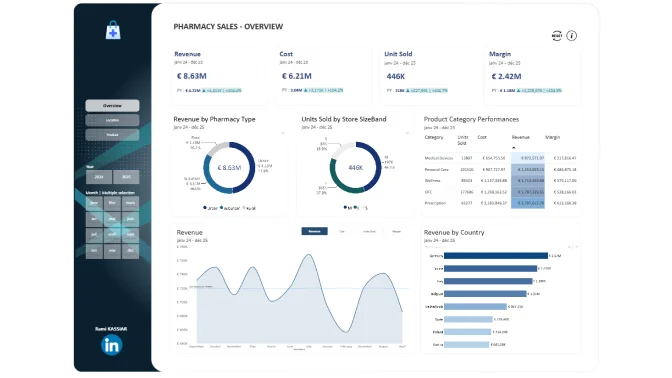
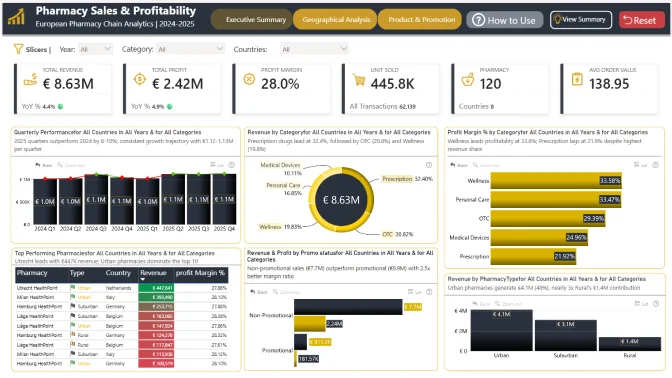
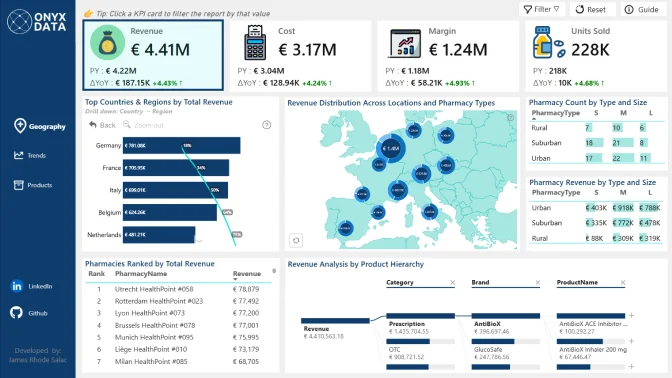
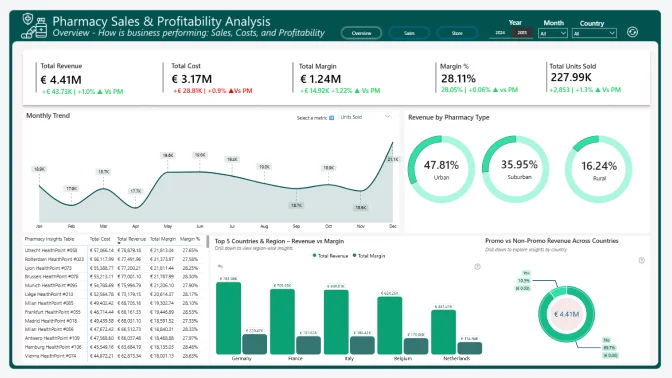
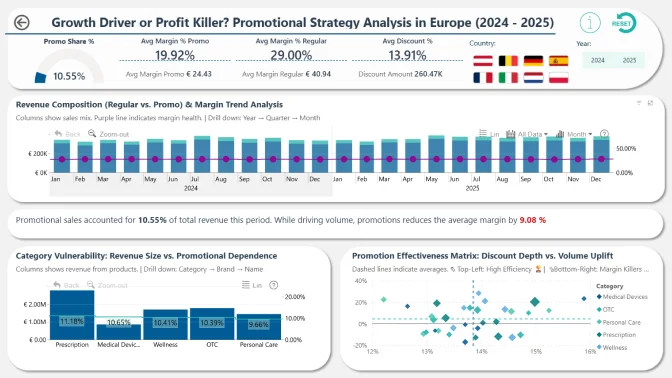
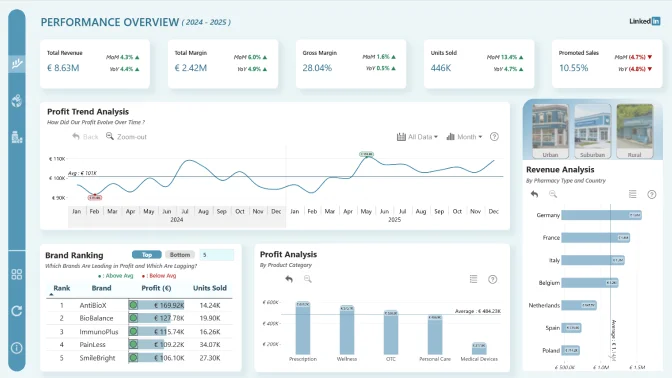
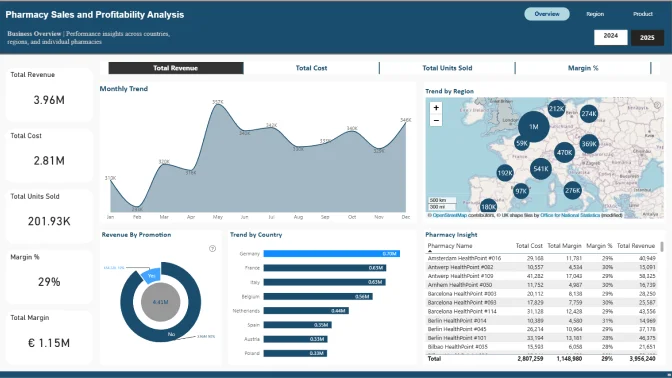
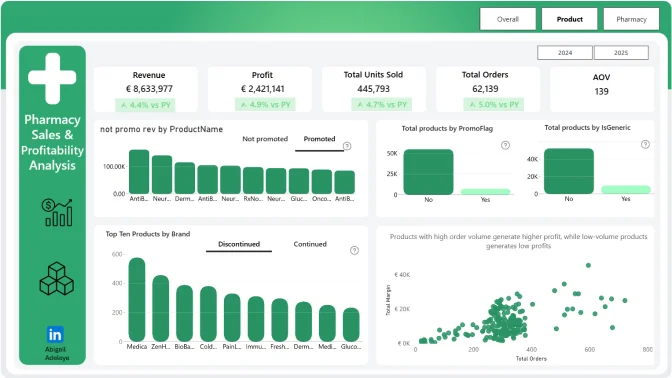
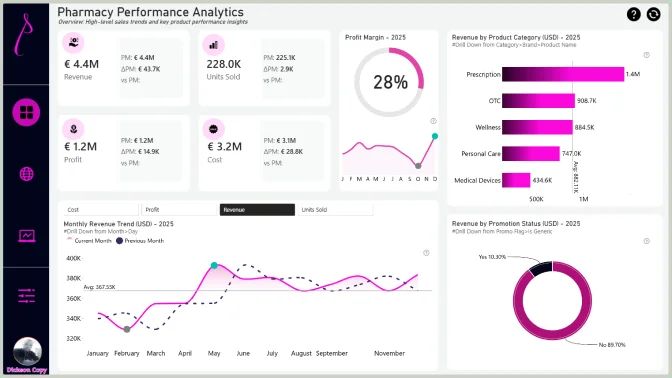
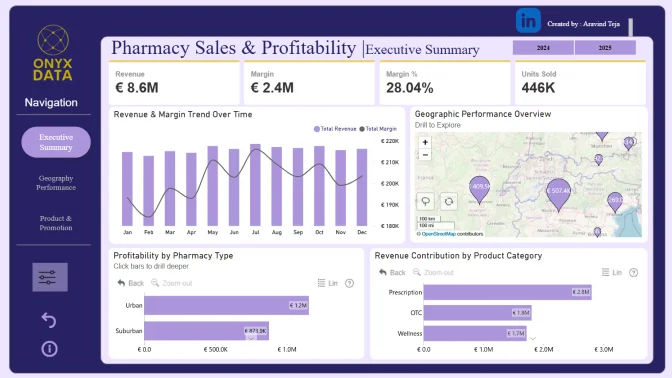
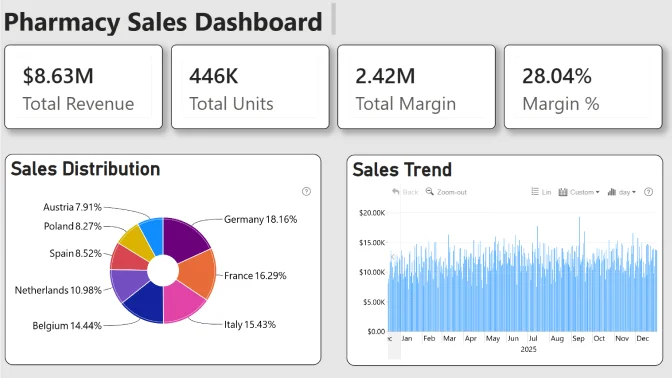
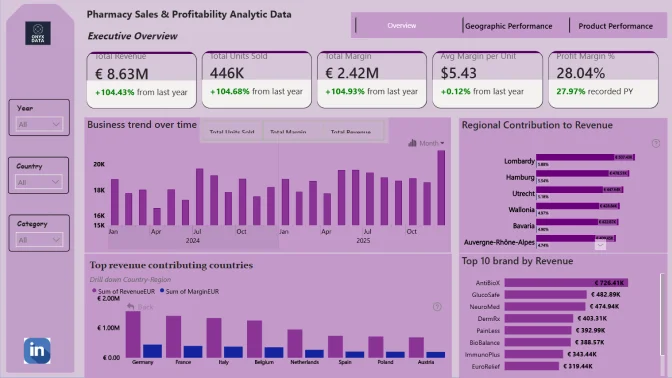
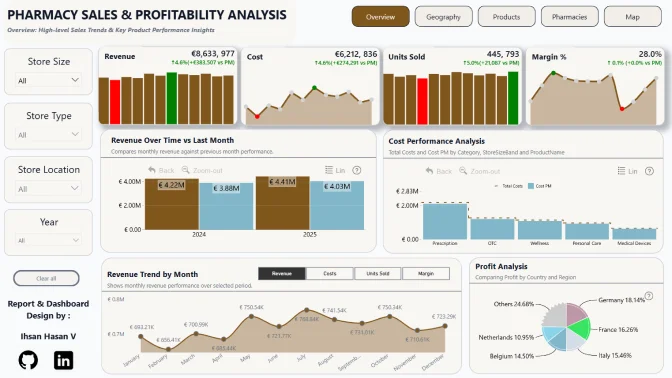
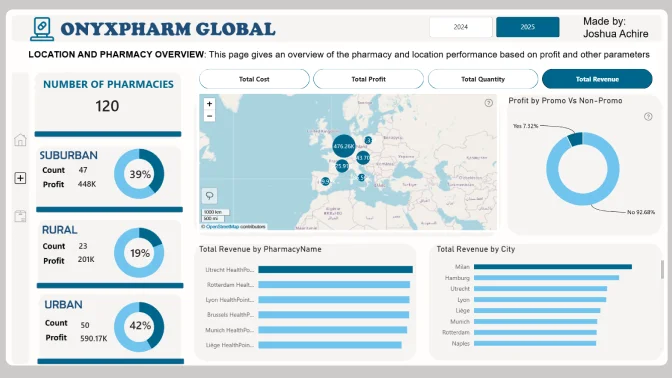
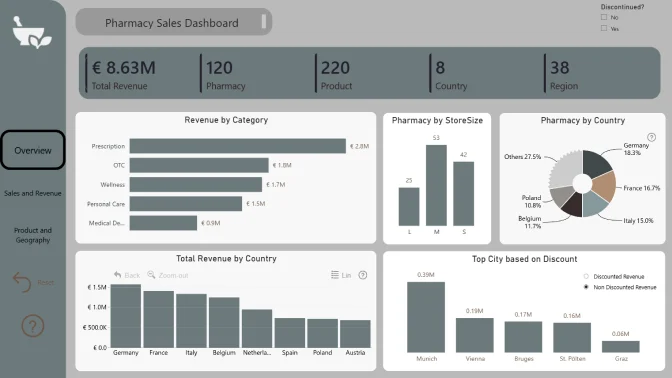
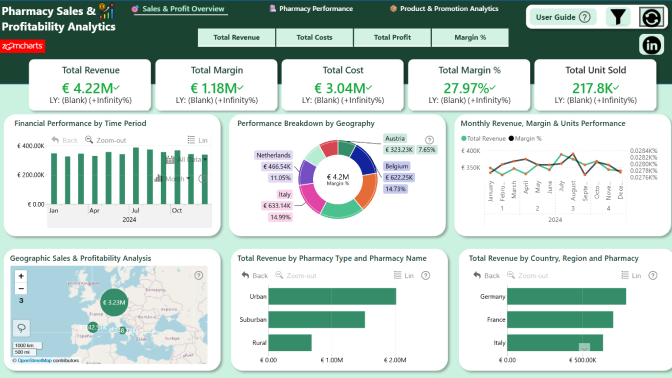
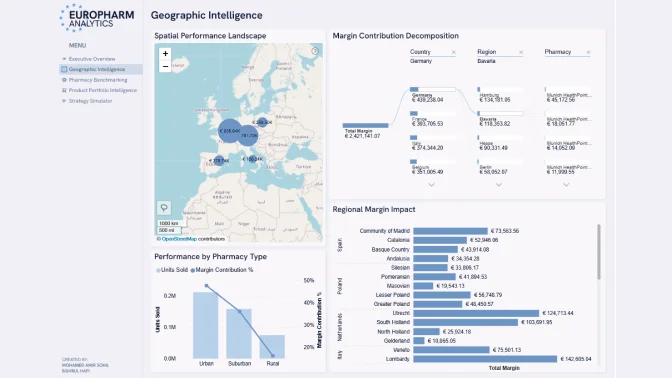
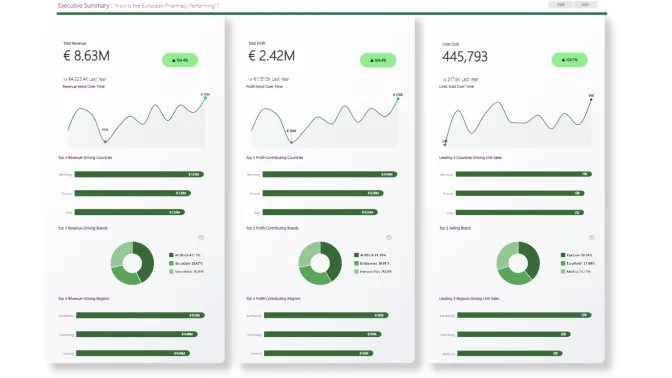
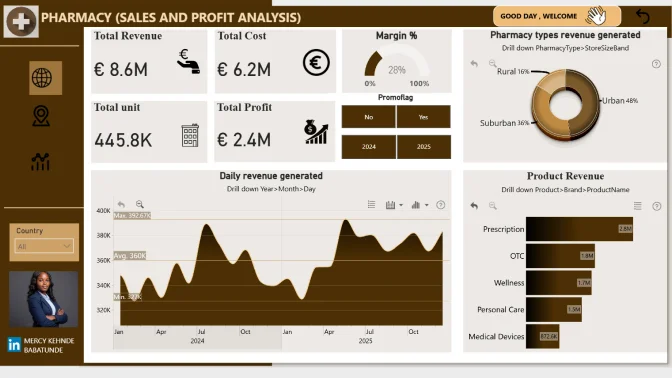
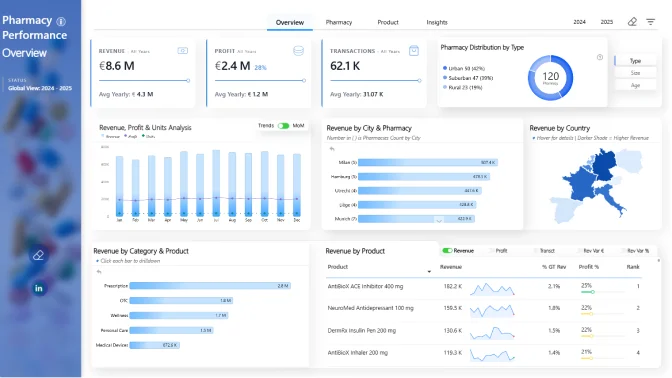
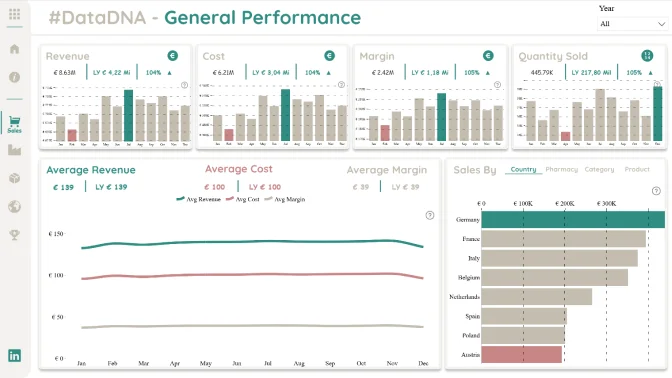
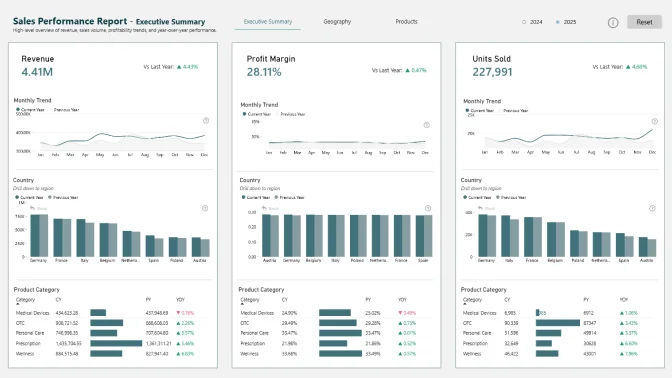
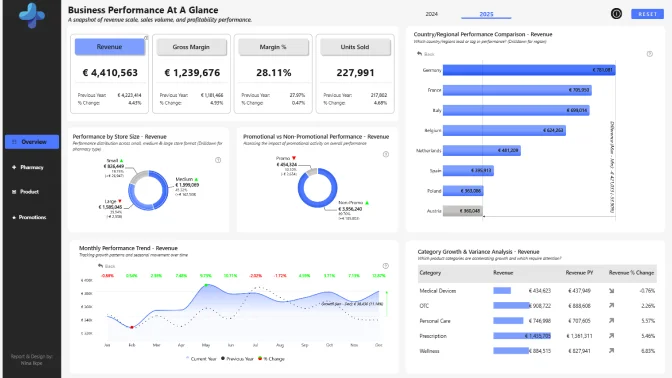
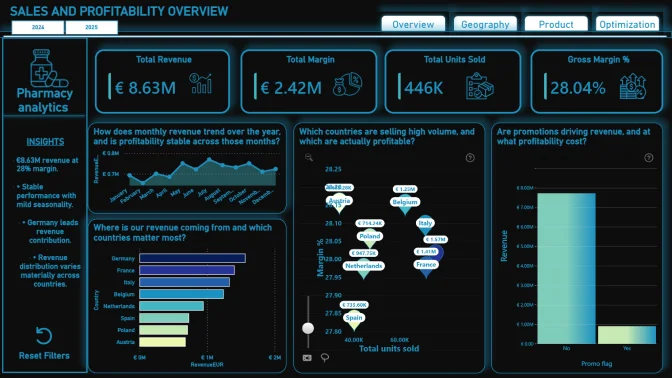
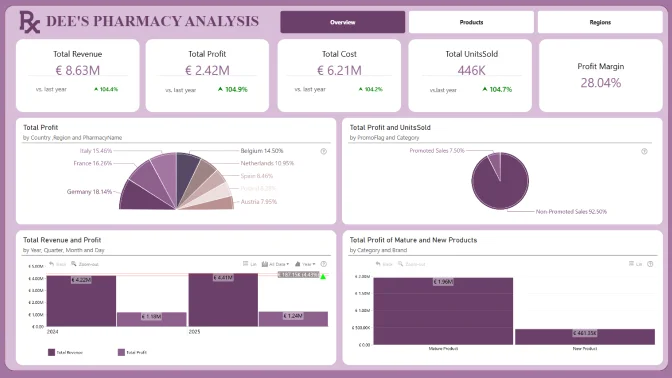
Analyze European pharmacy chain data, build stunning Power BI reports, and compete for a $300 prize.
Workshop | Building Insightful Pharmacy Sales & Profitability Dashboards in Power BI
Workshop | Building Insightful Pharmacy Sales & Profitability Dashboards in Power BI
15 January | 08:00
-
Webinar | Top 5 Pharmacy Sales & Profitability Reports: Power BI Best Practices Review
Webinar | Top 5 Pharmacy Sales & Profitability Reports: Power BI Best Practices Review
27 February | 07:00
05 January - 20 February
🏆 Main Prize: $300 Amazon Gift Card
Read about all prizes of Onyx Data #DataDNA challenge here.
ZoomCharts Mini Challenge is part of the global DataDNA – Dataset Challenge by Onyx Data, which unites 25K+ data enthusiasts worldwide, ranging from beginners to seasoned professionals, including Microsoft MVPs. Read more about the DataDNA challenge on the Onyx Data DataDNA website. Join the community on LinkedIn.
Benefits of Joining DataDNA ZoomCharts Mini Challenge:
Join LIVE Winner Announcement event on February 27 during a special live webinar session, where experts will review the Top 5 entries from the challenge.
Register using the form above.
Activate your free ZoomCharts Drill Down Visuals Developer License for Power BI.
Download the challenge dataset from the Onyx Data DataDNA Main Challenge website here.
Add your ZoomCharts license to Power BI Desktop
(watch the setup video or read the step-by-step guide).
Add ZoomCharts visuals from the Power BI visuals library or Microsoft Marketplace.
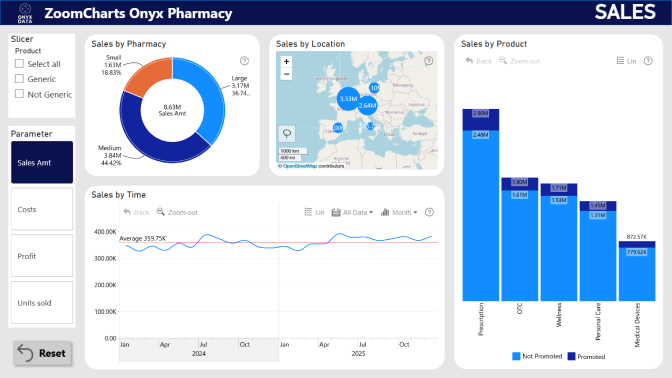
Use the dataset to build a Power BI report that includes at least two (2) ZoomCharts Drill Down Visuals on one report page.
Join the challenge workshop to learn how to use ZoomCharts visuals and the dataset.
If you need help, book a free consultation with the ZoomCharts team.
Browse past challenge submissions for inspiration and ideas.
Upload your report in .pbix format using the submission form on this page.
If your report does not meet the challenge requirements:
You will receive an email explaining what needs to be fixed. You can update your report and submit it again.
Validation timeline:
Your report will be reviewed within 1–2 business days.
Once validated, you will receive a Publish to Web link you can share publicly or add to your portfolio.
You will also receive personalized feedback from the evaluation team within 1–2 business days.
Use this to improve your report and resubmit before the deadline.
Note:
You can resubmit your entry as many times as needed before the final deadline.
Share a LinkedIn post showing your finished report (image, screenshot, or video).
Tag @ZoomCharts and @OnyxData, and use the hashtags #dataDNA and #builtwithzoomcharts.
After posting, submit the LinkedIn post link to the Onyx Data DataDNA Main Challenge to enter the prize competition.
Follow both ZoomCharts and Onyx Data on LinkedIn.
The ZoomCharts team reviews and analyzes the Top 5 Mini Challenge entries during live webinar.
You will learn best practices, improvement tips, and see how others solved the challenge.
The winner of the best report receives a $300 Amazon gift card from ZoomCharts.
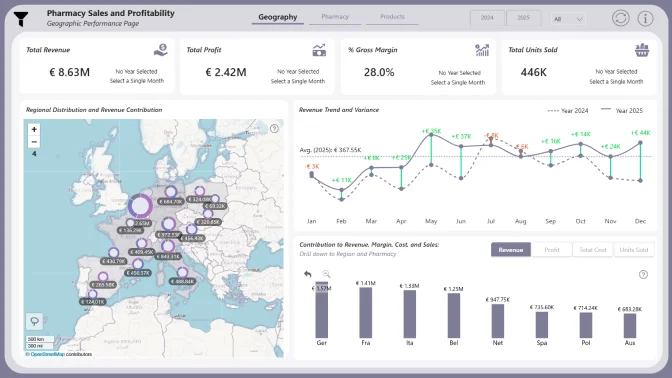
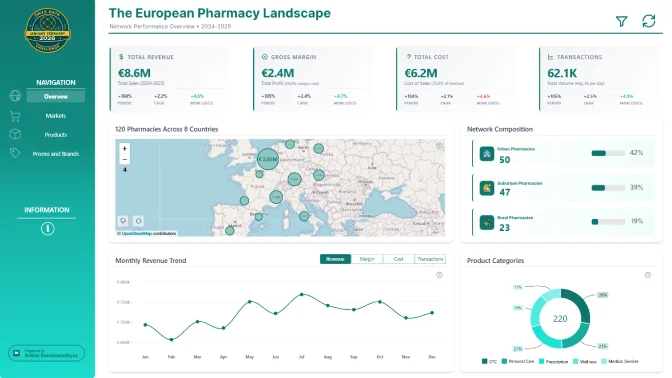
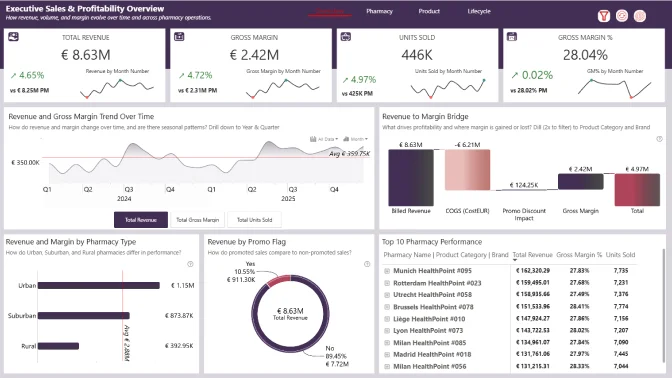
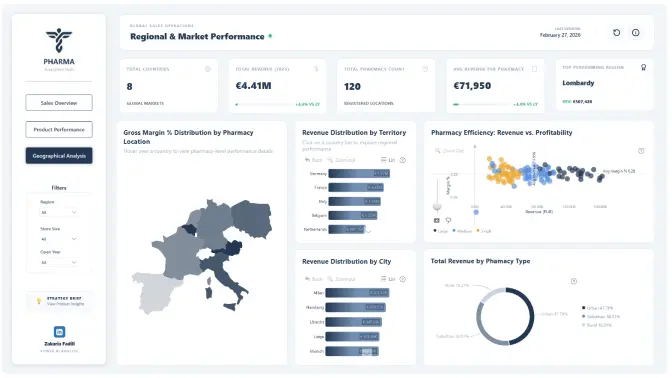
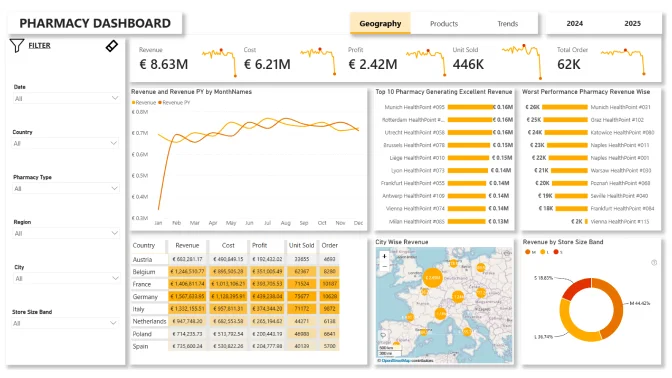
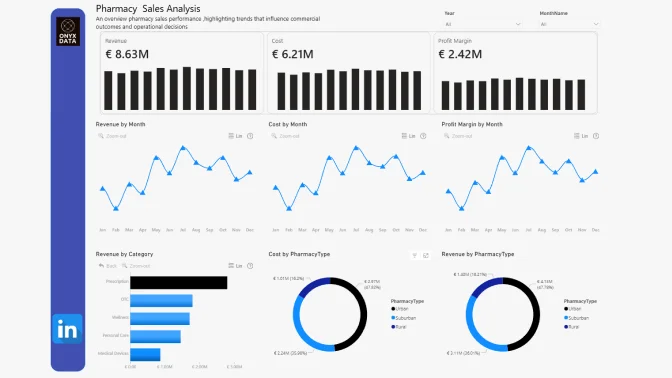
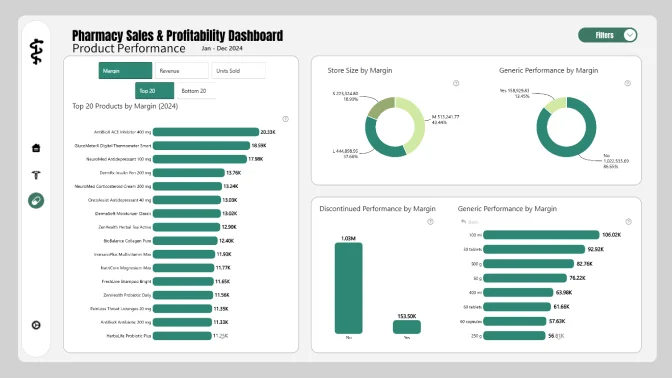
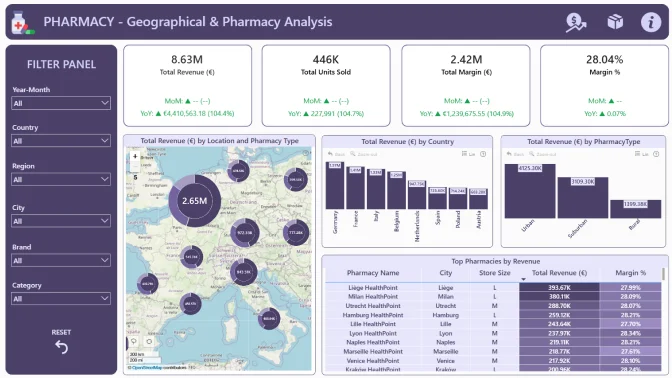
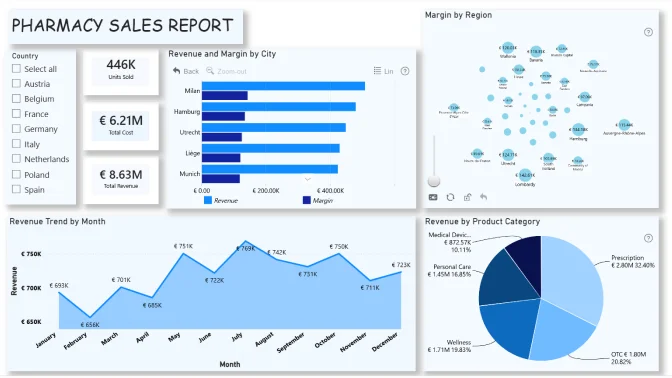
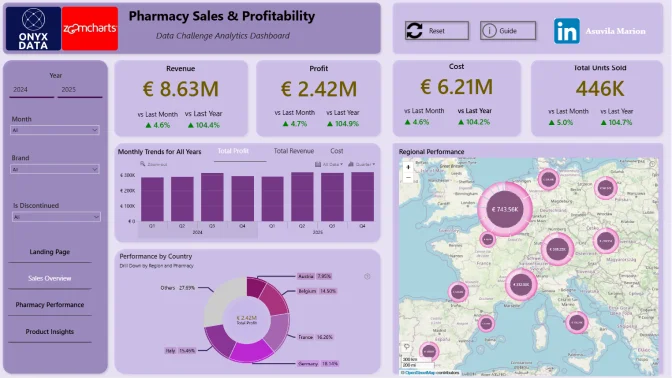
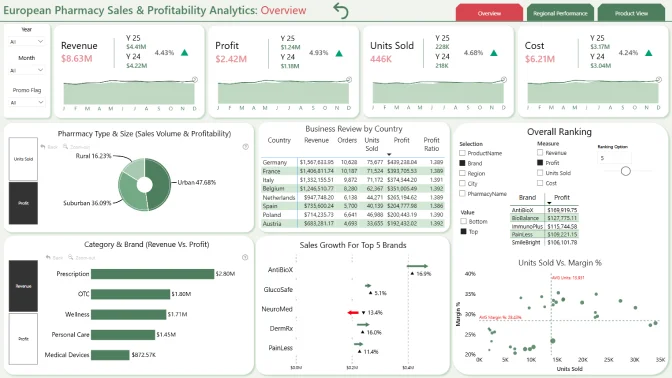
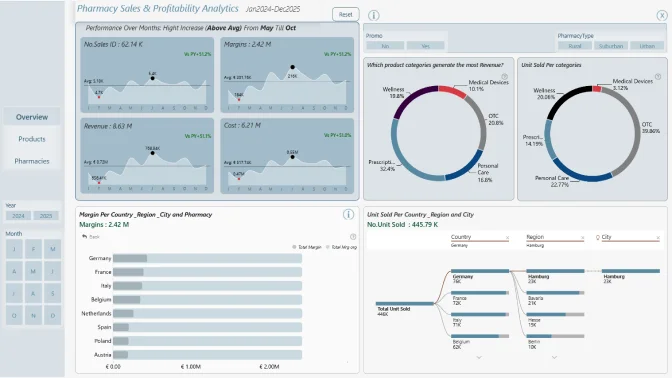
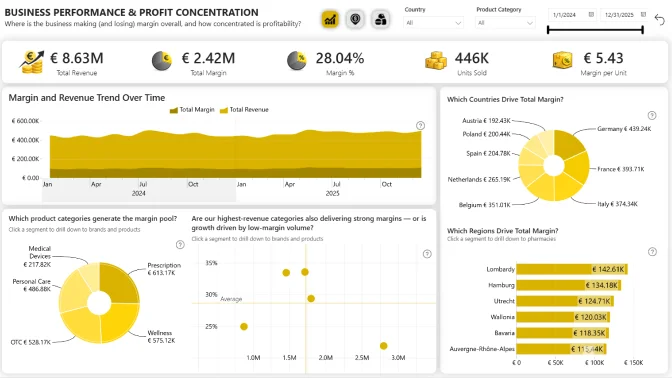
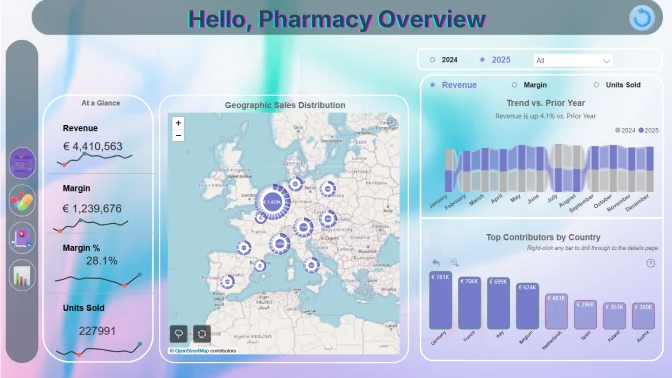
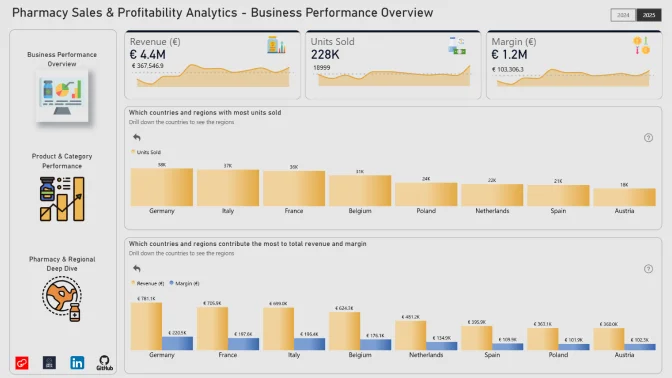
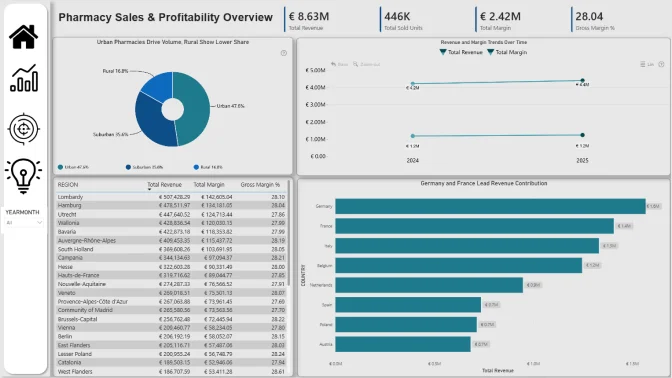
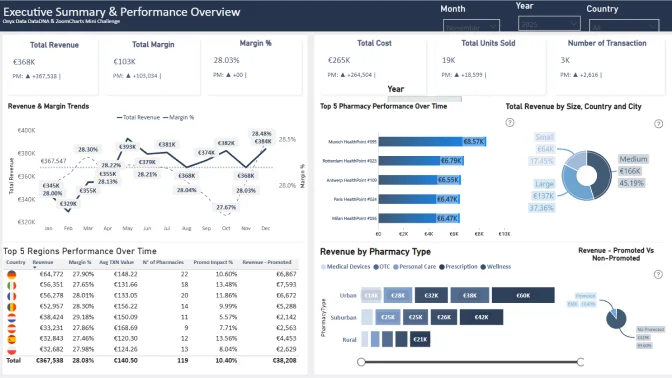
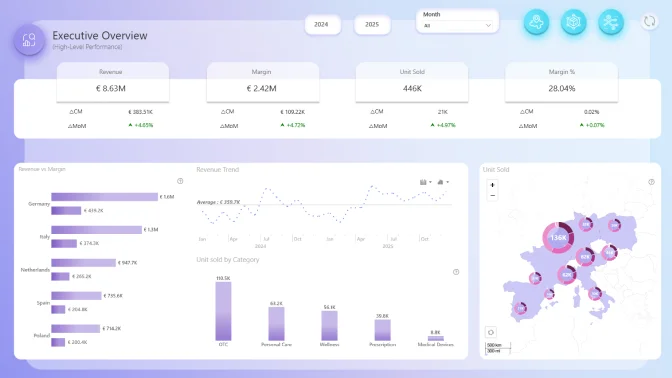
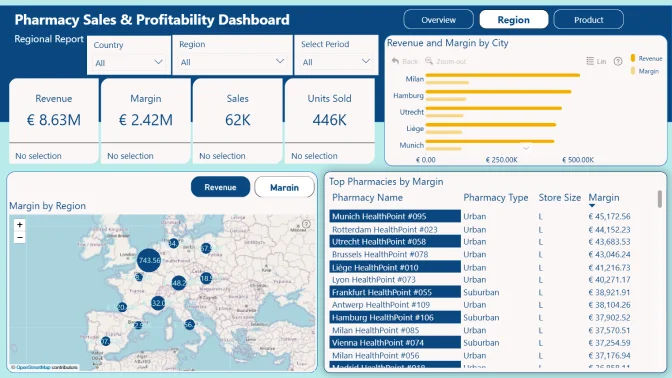
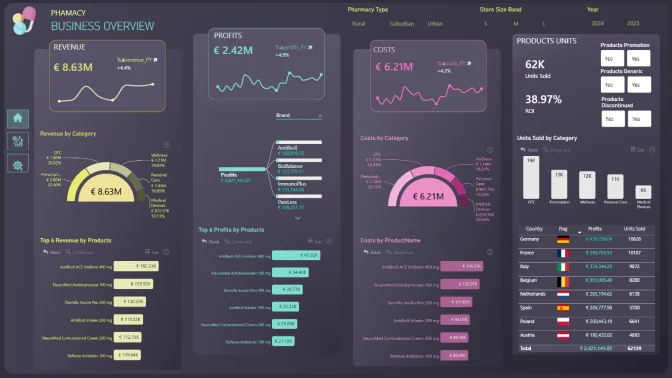
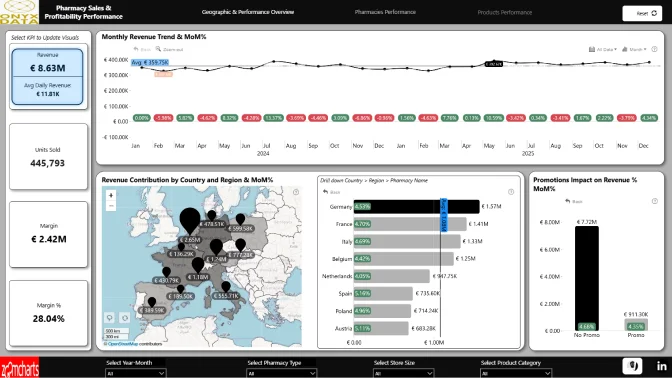
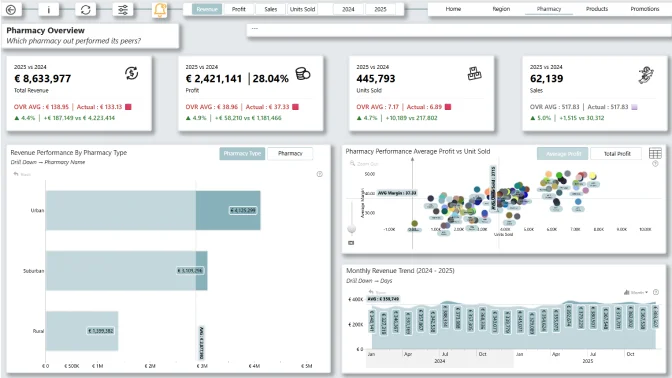
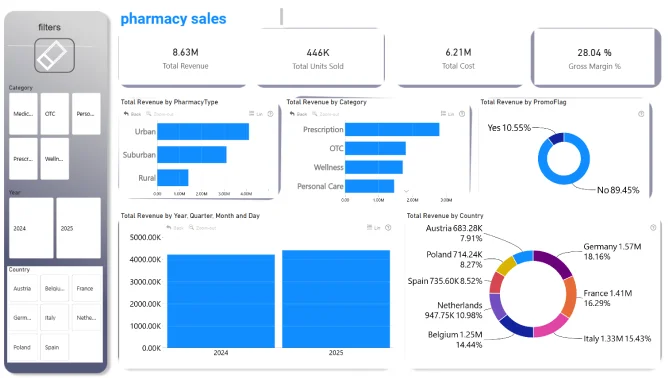
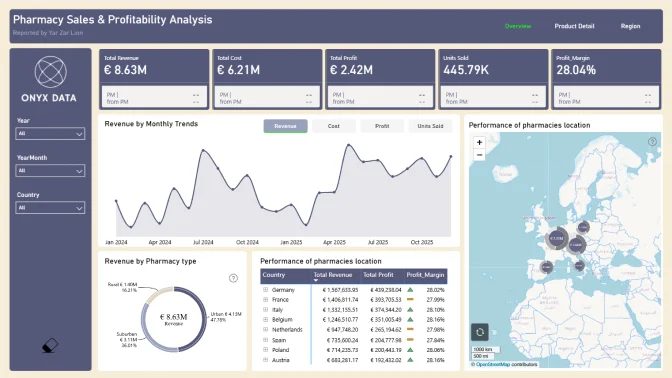
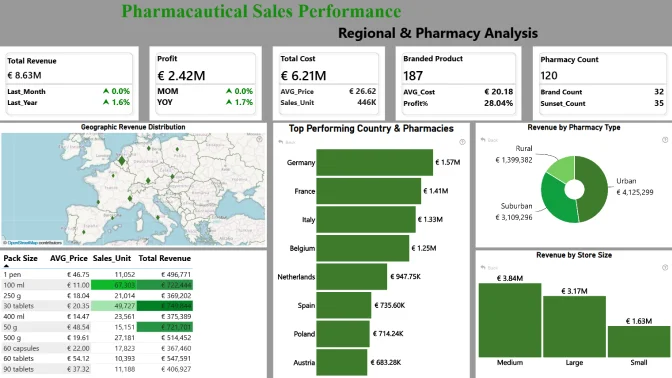
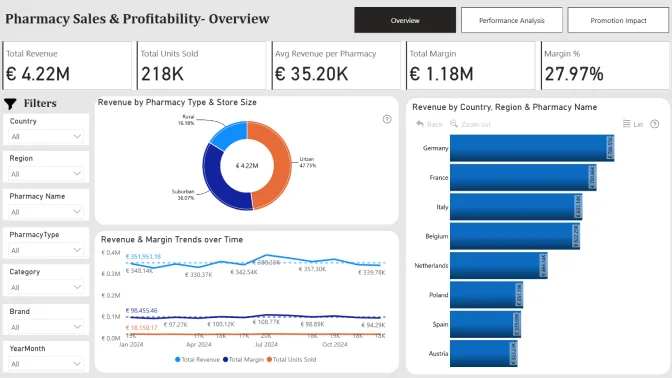
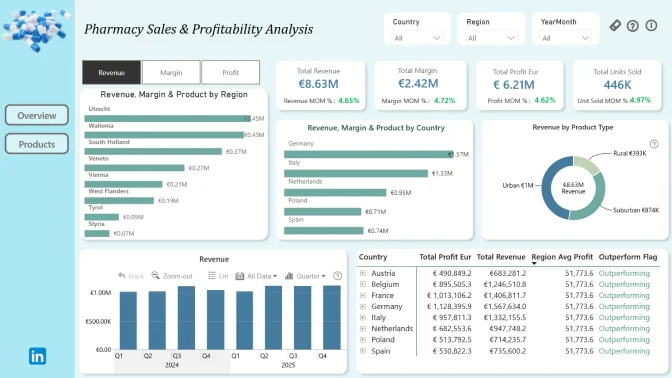
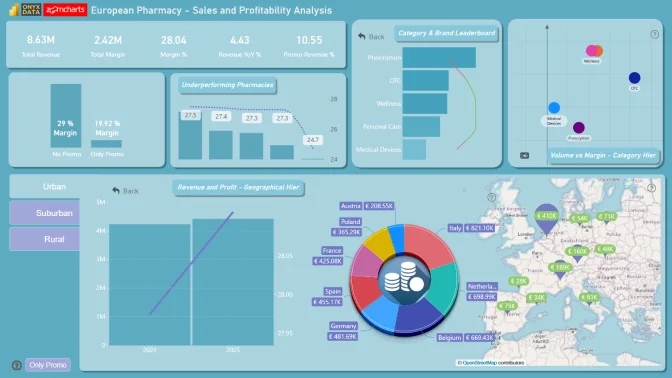
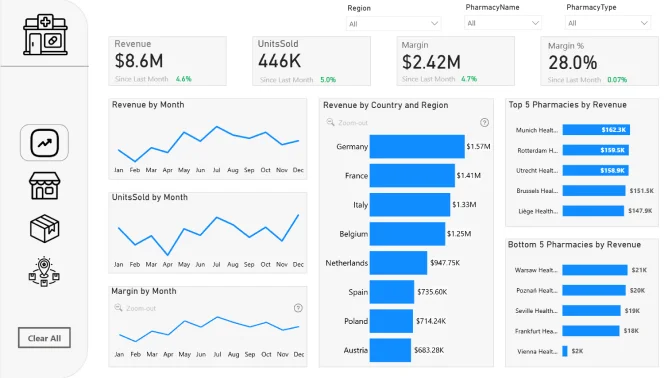
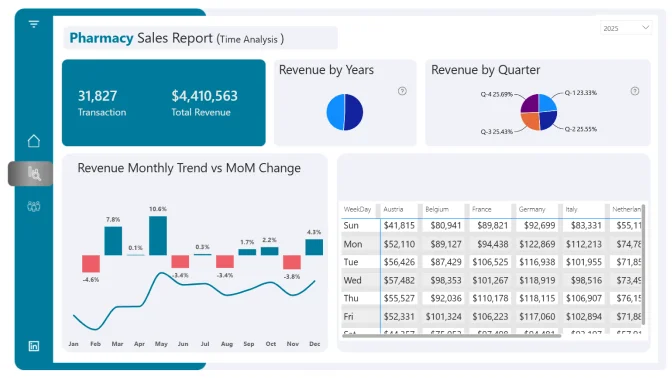
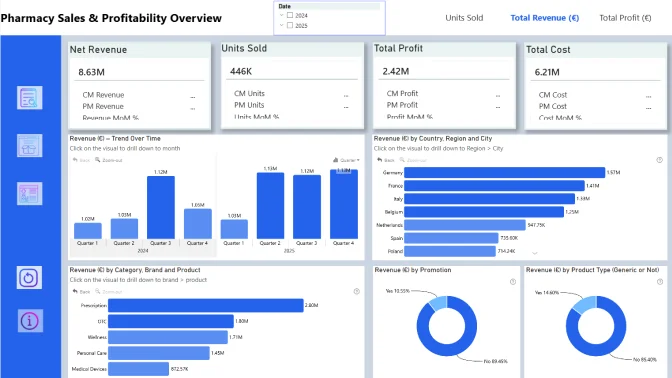
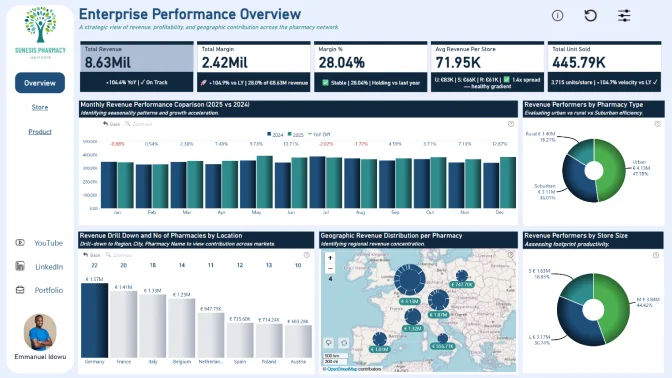
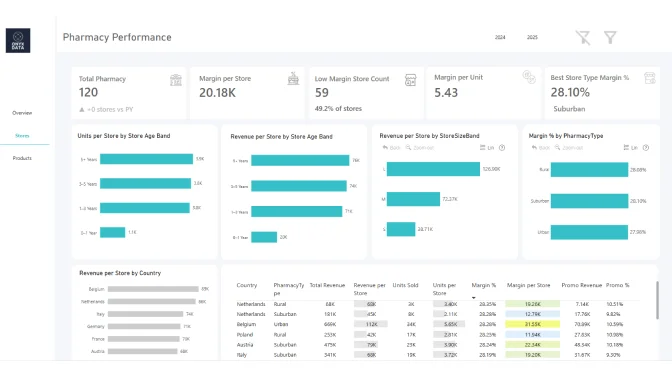
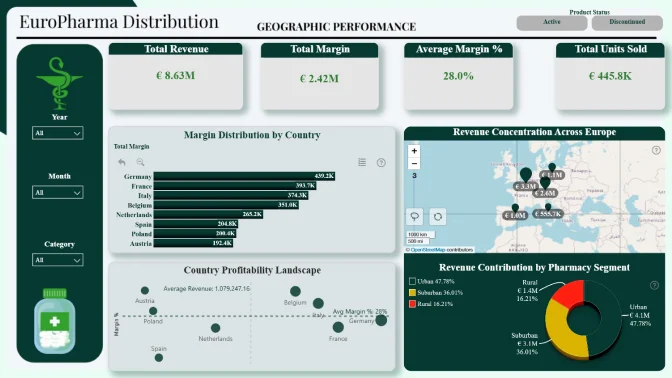
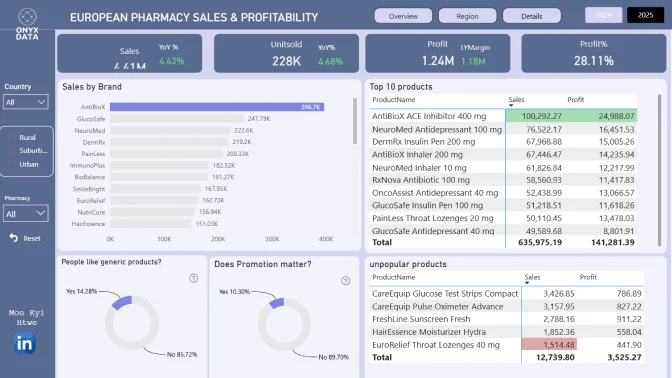
In this challenge, you will analyze a dataset representing a European pharmacy chain distributor operating across multiple European countries. The dataset includes daily sales transactions by pharmacy and product, with supporting dimensions for time, geography and product hierarchy.
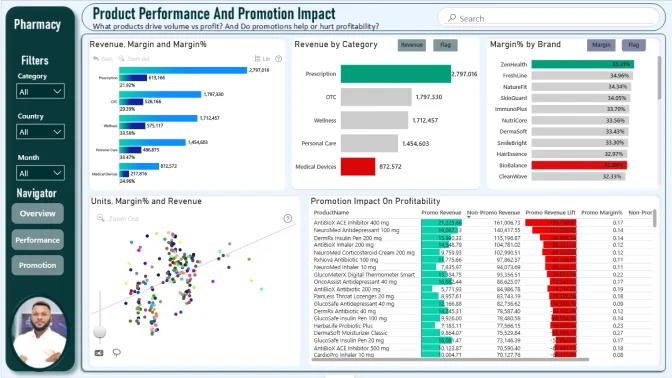
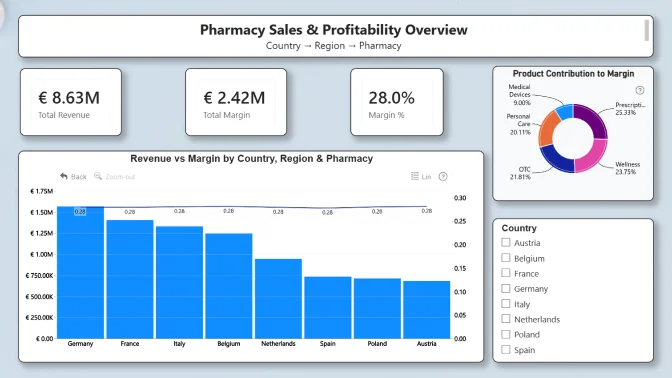
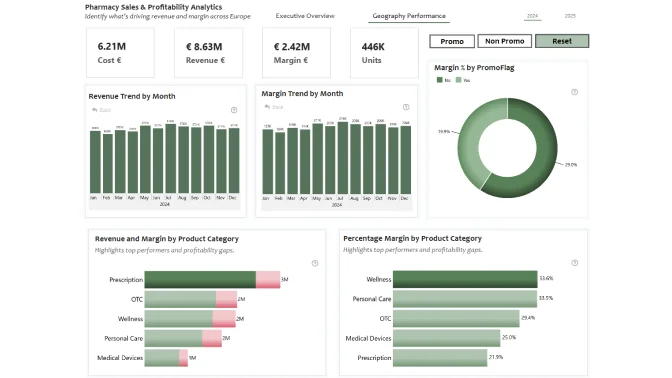
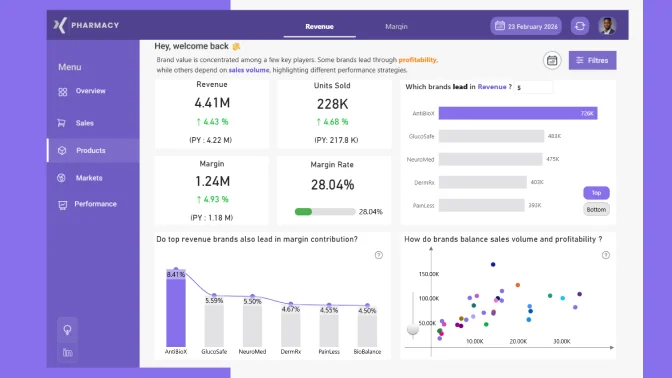
Your task is to build a Power BI report that helps stakeholders understand:
Note: These questions are starting points. Participants are encouraged to explore the dataset further and highlight patterns or comparisons that are not immediately obvious, as long as they are supported by the data.
Business users use reports to make data-driven decisions. That’s why reports are called effective if they enable users to drill down and filter data quickly and intuitively to find answers to any question they might have, and analyse data in all possible directions and dimensions.
Each report is evaluated based on three main criteria: intuitiveness, insightfulness, and interactivity. These factors ensure that the reports are not only accurate and functional, but also meet the target audience's needs and are ready to be presented to the end-users.
Workshop | Building Insightful Pharmacy Sales & Profitability Dashboards in Power BI
Workshop | Building Insightful Pharmacy Sales & Profitability Dashboards in Power BI
15 January | 08:00
-
Webinar | Top 5 Pharmacy Sales & Profitability Reports: Power BI Best Practices Review
Webinar | Top 5 Pharmacy Sales & Profitability Reports: Power BI Best Practices Review
27 February | 07:00
05 January - 20 February