Registration Open
Registration Open
01 December | 03:00
-
Reset your password
We'll email you instructions on how to reset your password
Your goal is to create a Power BI report that uncovers operational trends based on the Animal Shelter Dataset and supports data-driven decisions related to shelter capacity and resource planning.
Workshop | Analyzing Animal Shelter Operations in Power BI: Hands-On Workshop
Workshop | Analyzing Animal Shelter Operations in Power BI: Hands-On Workshop
03 December | 08:00
-
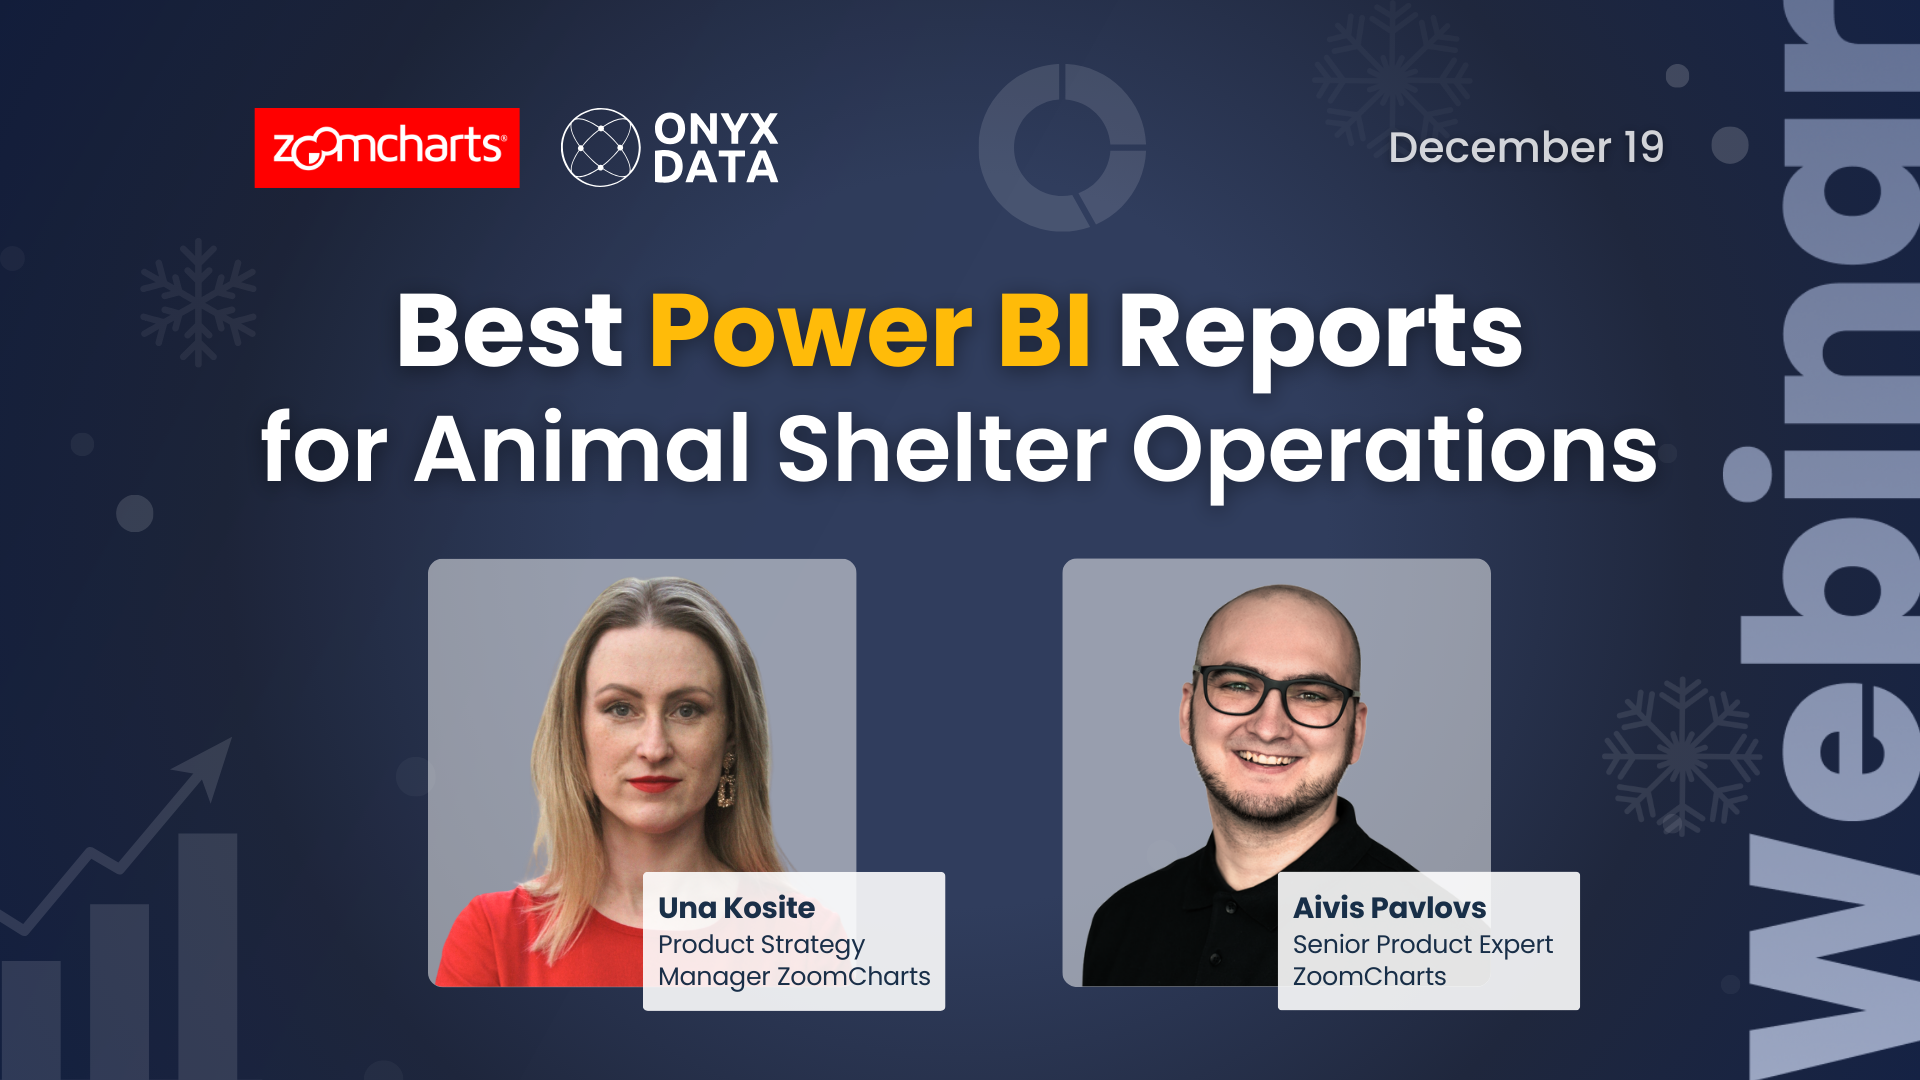
Webinar | Best Power BI Reports for Animal Shelter Operations: Challenge Winners Revealed
Webinar | Best Power BI Reports for Animal Shelter Operations: Challenge Winners Revealed
19 December | 07:00
01 December - 16 December
ZoomCharts Mini Challenge is part of the global DataDNA – Dataset Challenge by Onyx Data, which unites 25K+ data enthusiasts worldwide, ranging from beginners to seasoned professionals, including Microsoft MVPs. Read more about the DataDNA challenge on the Onyx Data DataDNA website. Join the community on LinkedIn.
Why join ZoomCharts Mini Challenge?
The ZoomCharts Mini Challenge winner will be announced on on December 19 during a special live webinar session, where experts will review the Top 5 entries from the challenge.
 Una Kosite, Product Owner at ZoomCharts
Register using the form above.
Activate your free ZoomCharts Drill Down Visuals Developer License for Power BI.
Download the challenge dataset from the Onyx Data DataDNA Main Challenge website here.
Add your ZoomCharts license to Power BI Desktop
(watch the setup video or read the step-by-step guide).
Add ZoomCharts visuals from the Power BI visuals library or Microsoft Marketplace.
Use the dataset to build a Power BI report that includes at least two (2) ZoomCharts Drill Down Visuals on one report page.
Join the challenge workshop to learn how to use ZoomCharts visuals and the dataset.
If you need help, book a free consultation with the ZoomCharts team.
Browse past challenge submissions for inspiration and ideas.
Upload your report in .pbix format using the submission form on this page.
If your report does not meet the challenge requirements:
You will receive an email explaining what needs to be fixed. You can update your report and submit it again.
Validation timeline:
Your report will be reviewed within 1–2 business days.
Once validated, you will receive a Publish to Web link you can share publicly or add to your portfolio.
You will also receive personalized feedback from the evaluation team within 1–2 business days.
Use this to improve your report and resubmit before the deadline.
Note:
You can resubmit your entry as many times as needed before the final deadline.
Share a LinkedIn post showing your finished report (image, screenshot, or video).
Tag @ZoomCharts and @OnyxData, and use the hashtags #dataDNA and #builtwithzoomcharts.
After posting, submit the LinkedIn post link to the Onyx Data DataDNA Main Challenge to enter the prize competition.
Follow both ZoomCharts and Onyx Data on LinkedIn.
The ZoomCharts team reviews and analyzes the Top 5 Mini Challenge entries during live webinar.
You will learn best practices, improvement tips, and see how others solved the challenge.
The winner of the best report receives a $300 Amazon gift card from ZoomCharts.
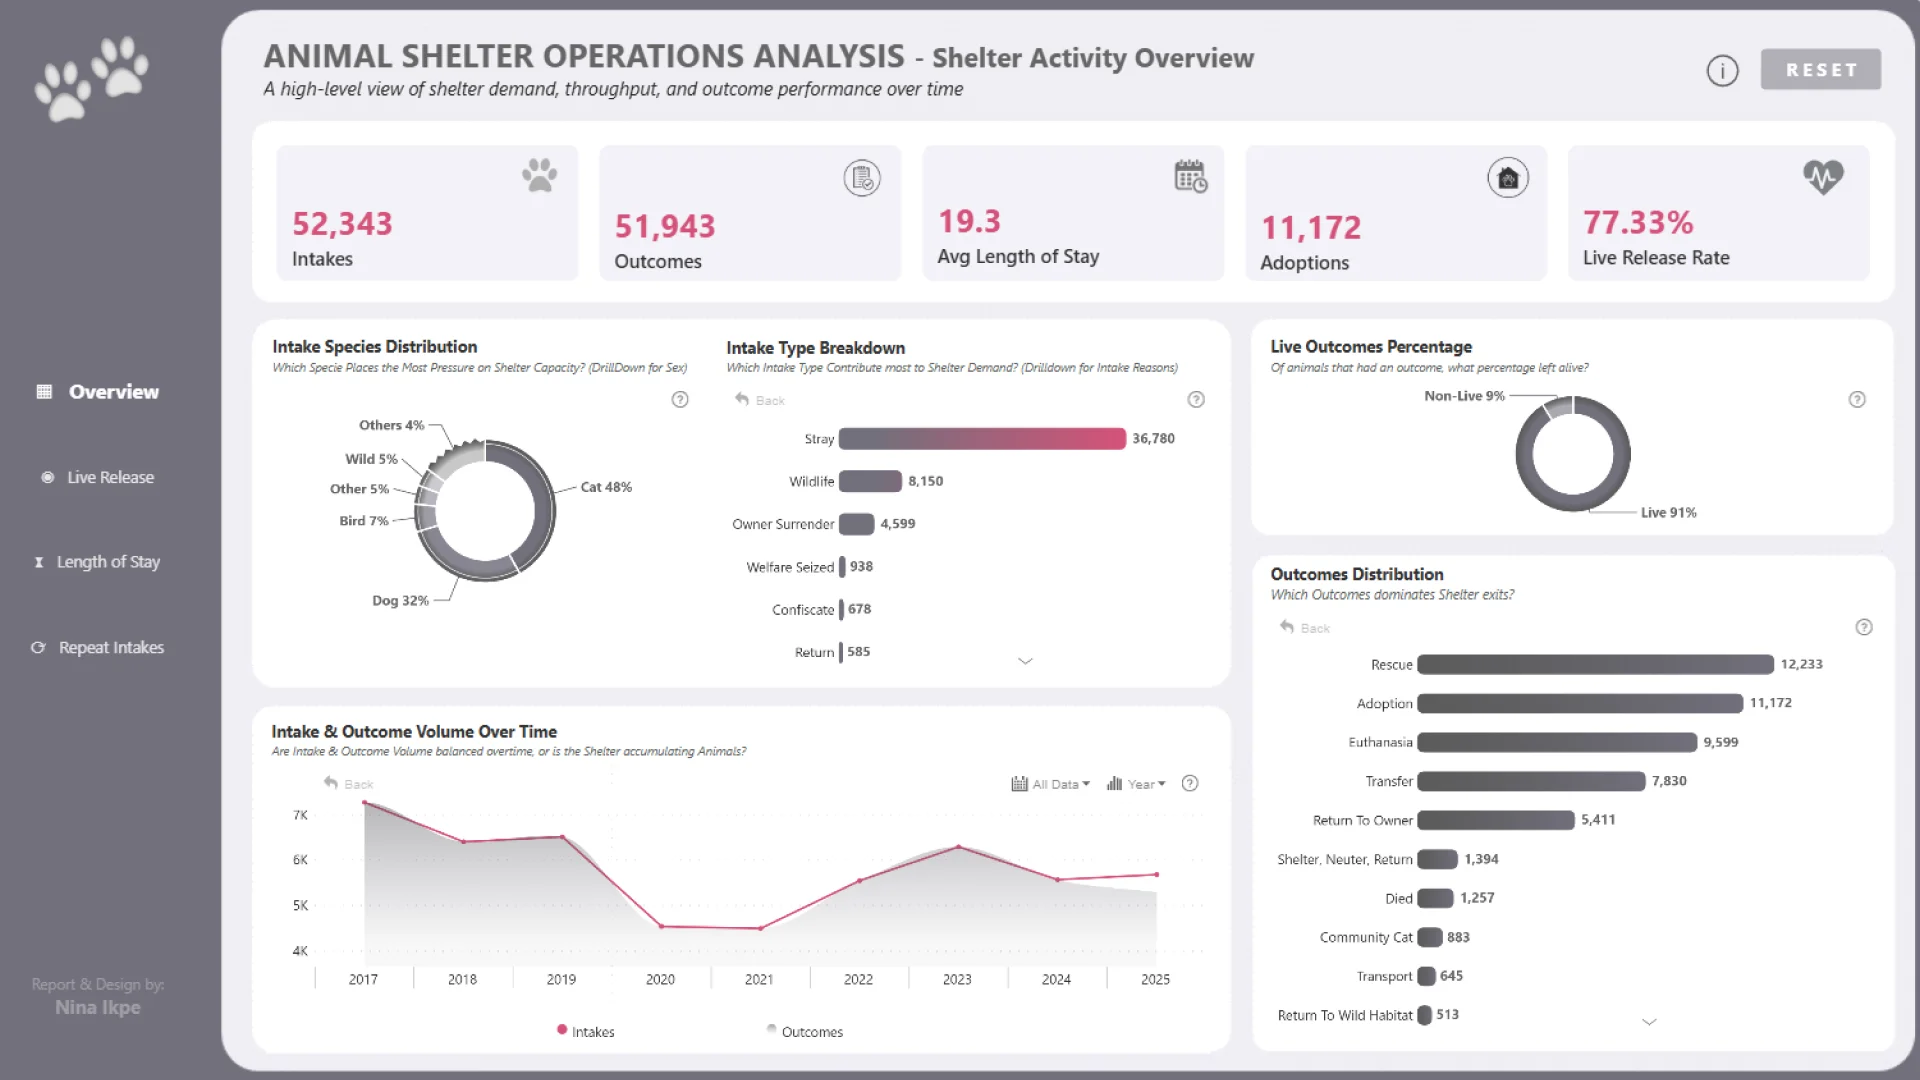
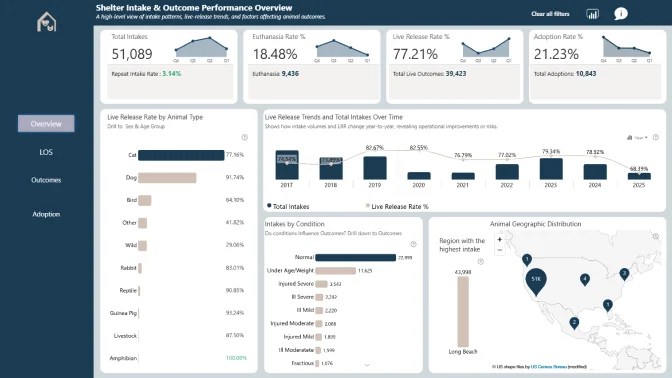
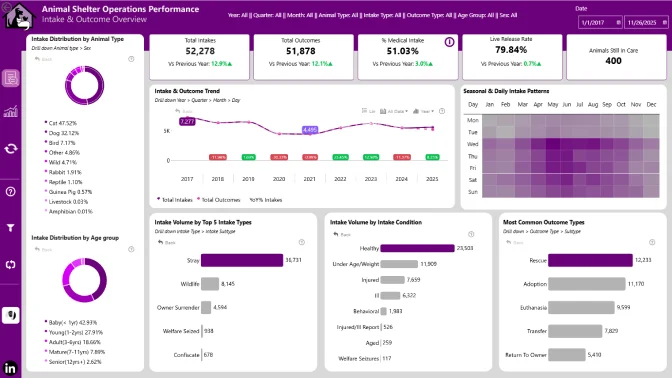
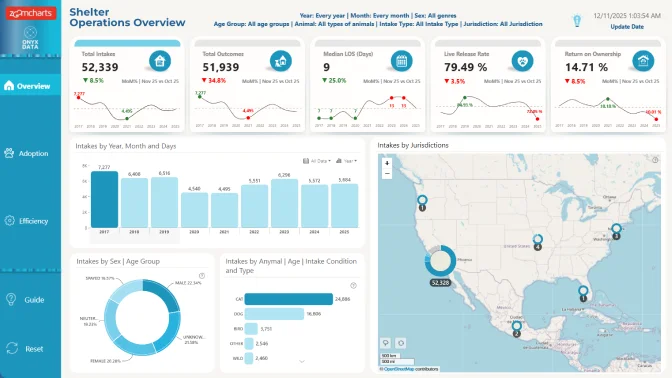
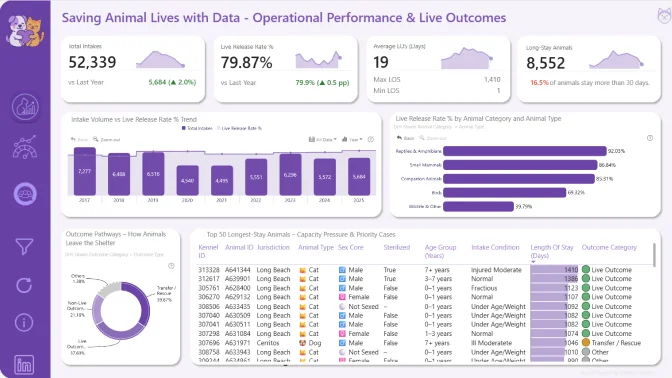
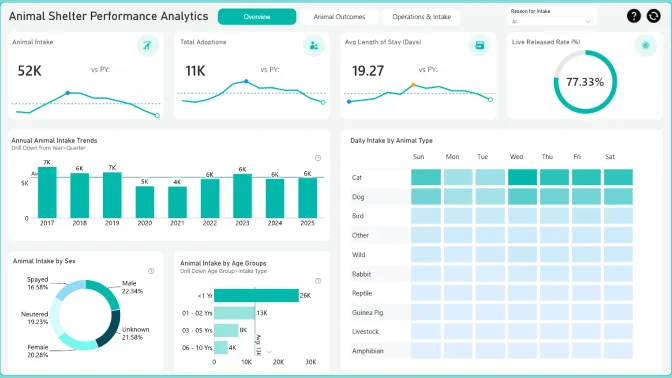
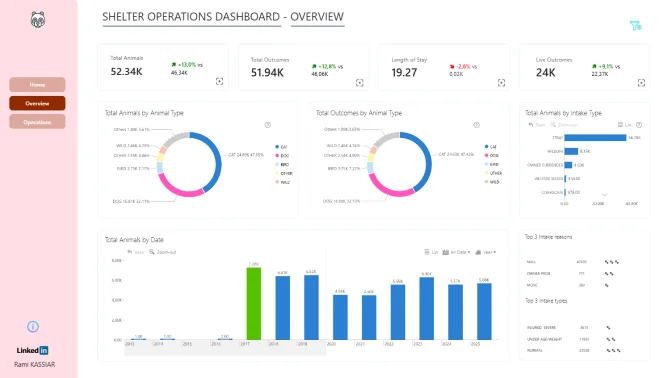
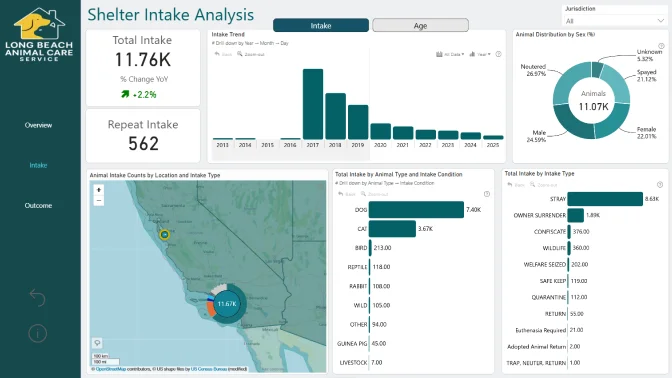
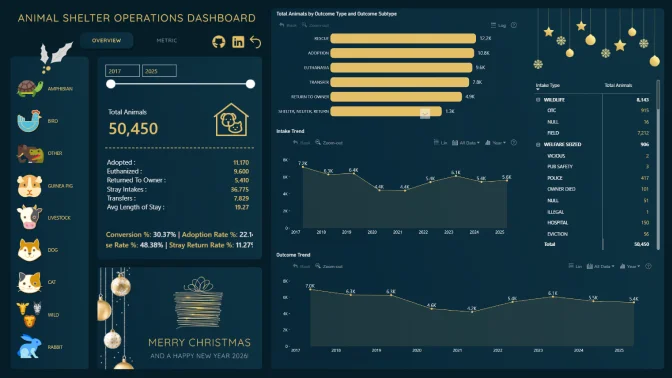
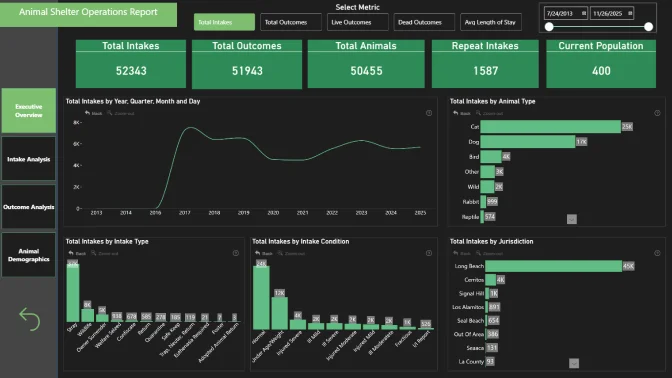
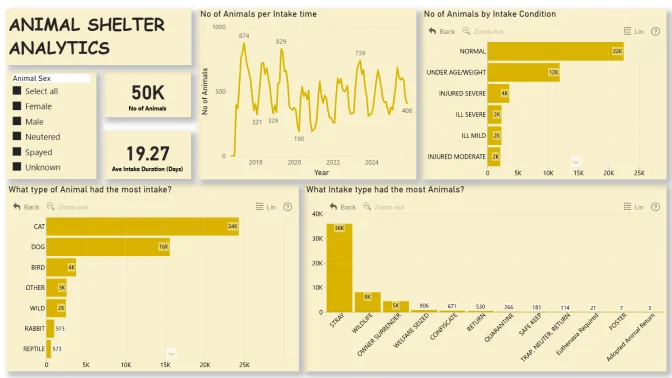
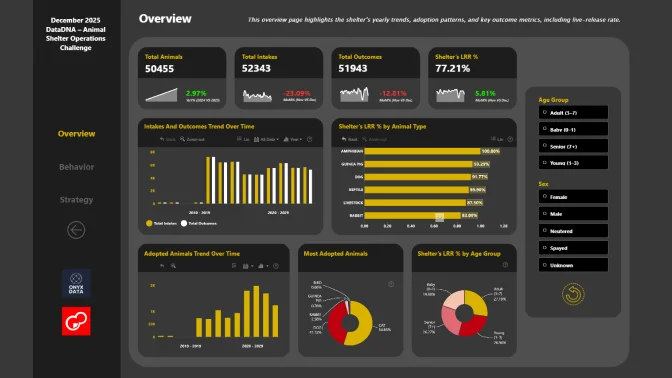
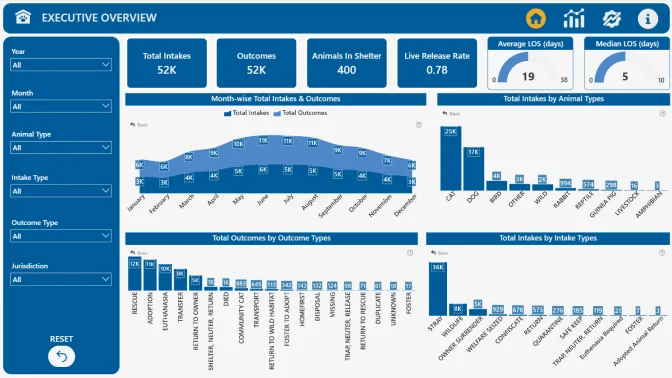
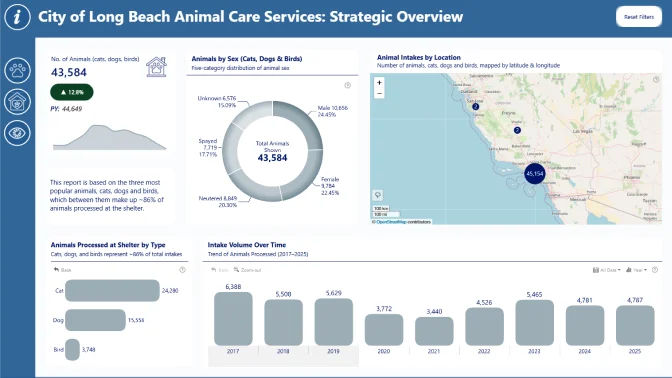
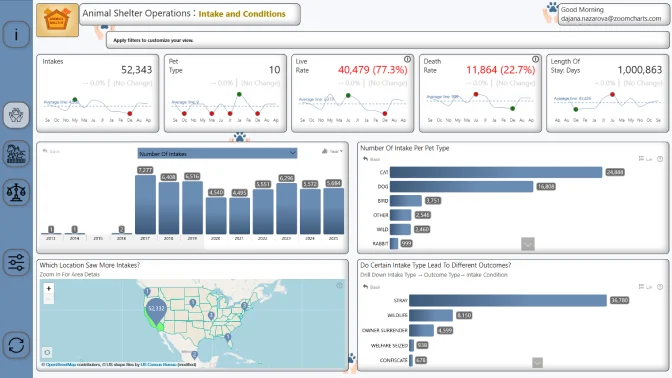
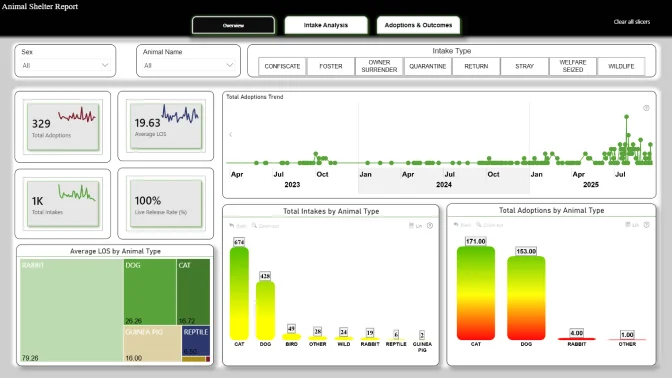
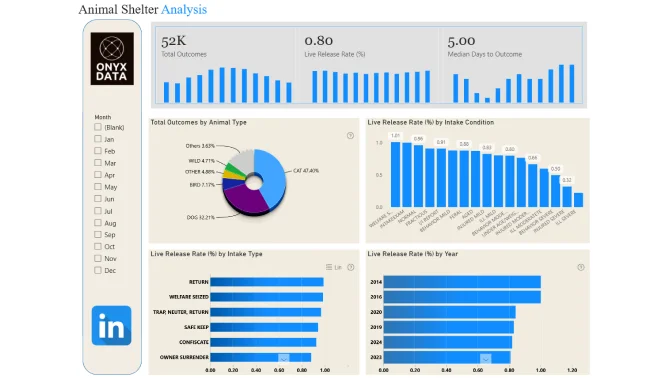
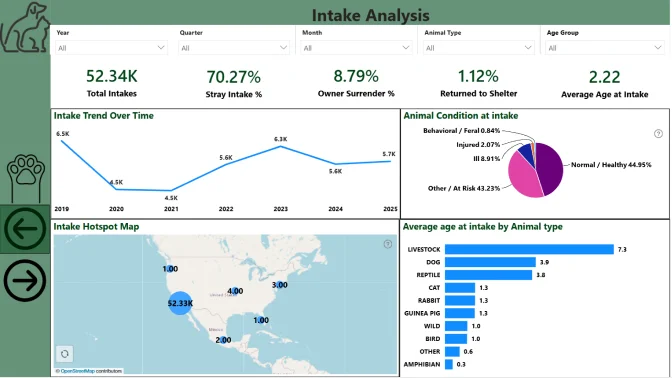
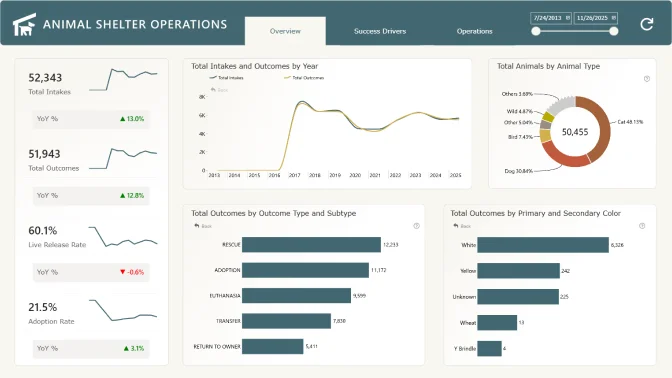
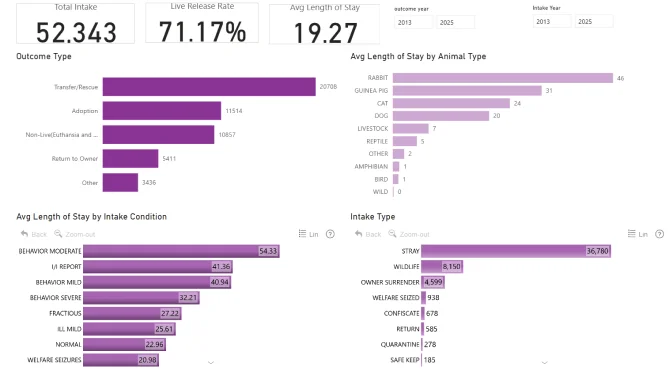
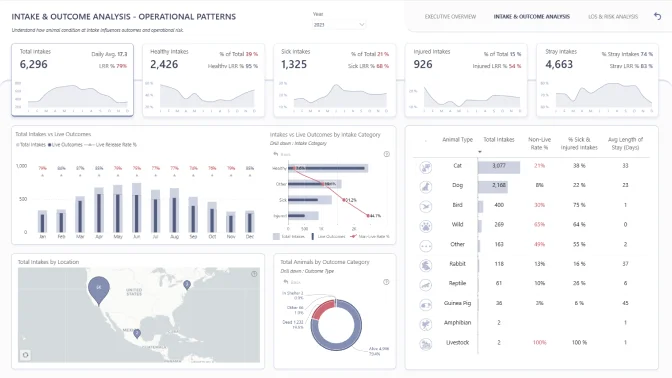
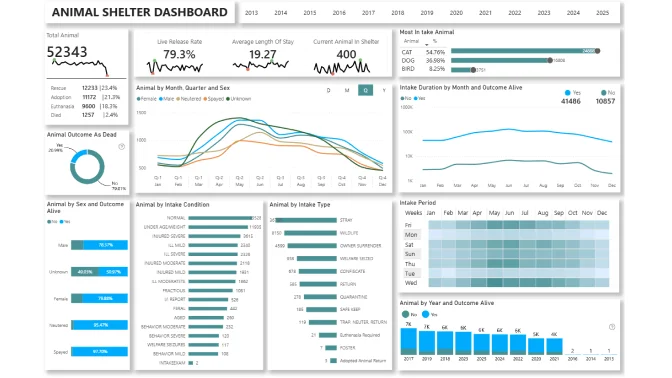
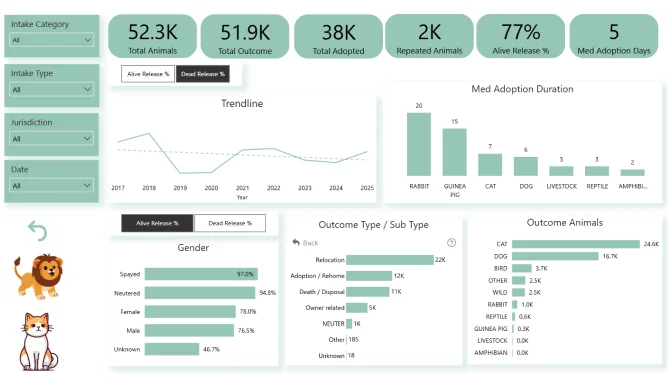
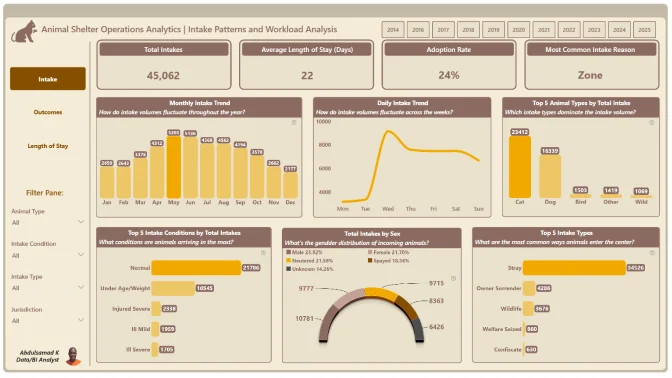
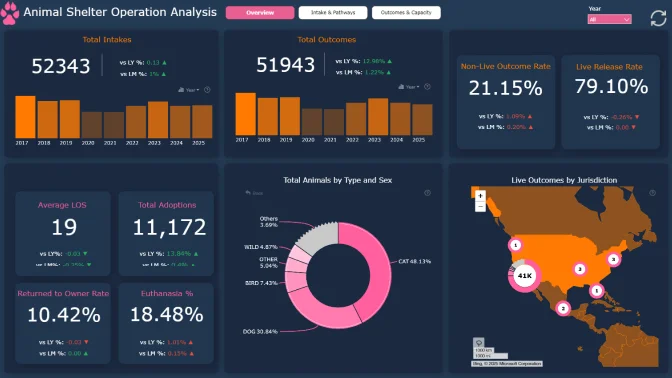
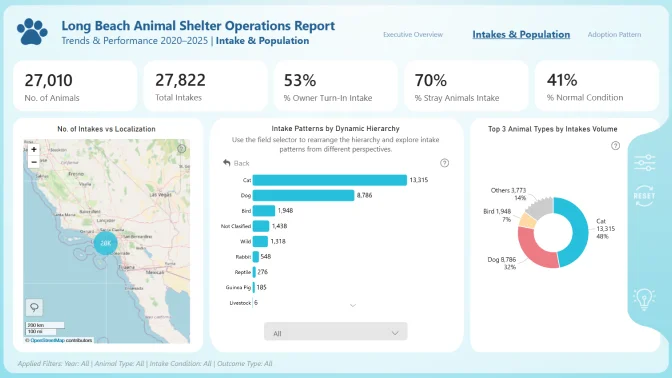
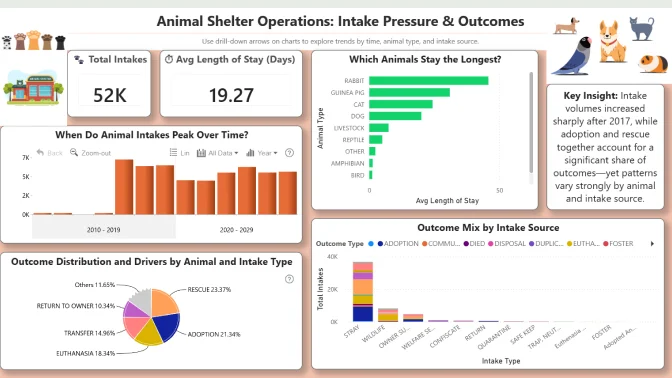
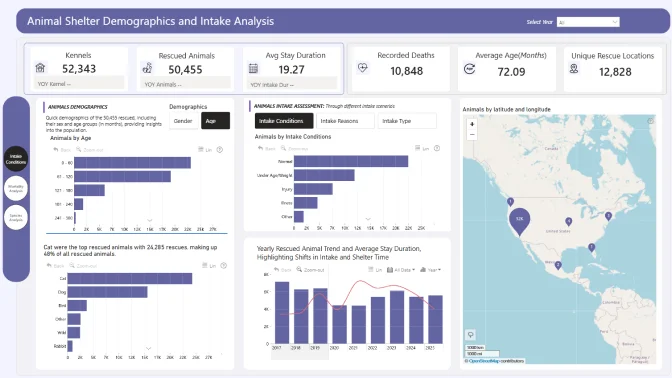
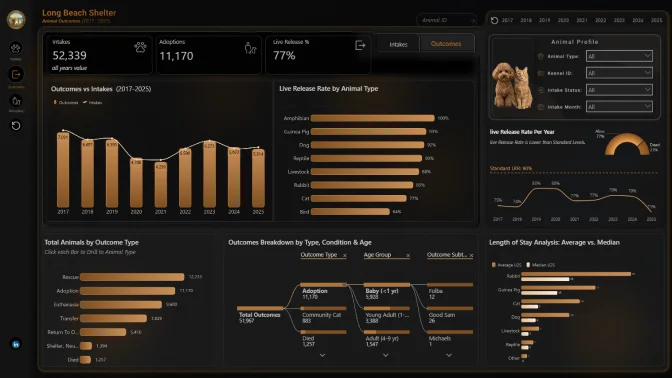
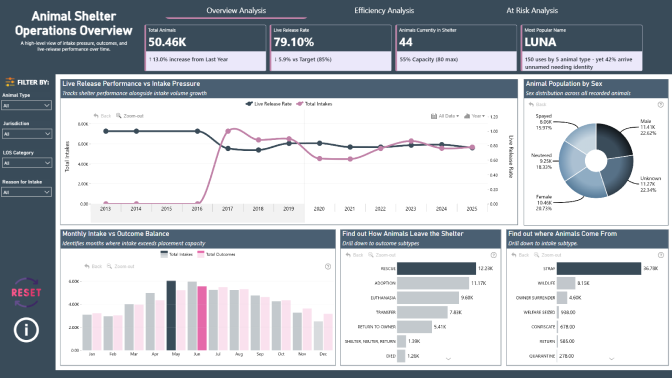
In this challenge, you will analyze the Animal Shelter Intakes and Outcomes dataset from the City of Long Beach Animal Care Services. The dataset includes detailed information about each animal entering or leaving the shelter, such as species, intake type, condition, outcome type, and length of stay.
Your goal is to create a Power BI report that uncovers operational trends, improves understanding of live-release performance, and supports data-driven decisions related to shelter capacity, resource planning, and animal welfare outcomes.
This dataset allows you to analyze:
Your analysis should help the shelter and partners understand where to focus strategic effort and manage resources more effectively.
Explore the data dictionary here
Key Questions:
✨ Note: These questions are just starting points. You’re encouraged to explore the data in your own way and share any unexpected findings that could.
Business users use reports to make data-driven decisions. That’s why reports are called effective if they enable users to drill down and filter data quickly and intuitively to find answers to any question they might have, and analyse data in all possible directions and dimensions.
Each report is evaluated based on three main criteria: intuitiveness, insightfulness, and interactivity. These factors ensure that the reports are not only accurate and functional, but also meet the target audience's needs and are ready to be presented to the end-users.
Workshop | Analyzing Animal Shelter Operations in Power BI: Hands-On Workshop
Workshop | Analyzing Animal Shelter Operations in Power BI: Hands-On Workshop
03 December | 08:00
-
Webinar | Best Power BI Reports for Animal Shelter Operations: Challenge Winners Revealed
Webinar | Best Power BI Reports for Animal Shelter Operations: Challenge Winners Revealed
19 December | 07:00
01 December - 16 December