Join the DataDNA ZoomCharts Mini Challenge in August! Analyse the Fitness Membership dataset and help optimize business decisions based on real data insights.
ZoomCharts Mini Challenge is part of the global DataDNA – Dataset Challenge by Onyx Data, which unites 25K+ data enthusiasts worldwide, ranging from beginners to seasoned professionals, including Microsoft MVPs. Read more about the DataDNA challenge on the Onyx Data DataDNA website. Join the community on LinkedIn.
Why join ZoomCharts Mini Challenge?
Workshops & 1:1 Mentoring: Learn directly from experienced Power BI professionals through live workshops on report-building best practices, 1:1 mentoring sessions to review your report and get tailored advice.
Get Personal Feedback: Every participant receives detailed, personalized feedback on their report - a great opportunity to improve based on real input from seasoned analysts.
Free ZoomCharts PRO License: All participants get a ZoomCharts Developer License (worth hundreds of dollars) that gives full access to the Drill Down PRO visuals library.
🏆 Prize:
The creator of the best report submitted to the Mini Challenge will receive a $300 Amazon gift card. The ZoomCharts winner will be announced in a special live webinar session on August 28, where we will review the Top 5 entries from the challenge.
Set up an account in Power BI using the assigned license details (if you have participated in ZoomCharts Challenges in the past, you can use the same account you set up before).
Use the account to access the full library of custom ZoomCharts Drill Down visuals.
Use the dataset to build a Power BI report including at least 2 ZoomCharts Drill Down Visuals in one report page.
3. Improve your report and learn new skills:
To learn more about applying ZoomCharts visuals in your reports, participate in the challenge workshop.
Check out the submissions from past challenges for inspiration.
4. Submit your challenge entry:
Submit your report in .pbix format for validation using the form on this page.
If your submission doesn’t match the challenge criteria, you will be notified by email indicating the reason. Don't worry if this happens! You can fix the issue and resubmit your report.
Your report will be reviewed within 1–2 business days. Once it’s validated, you’ll receive a Publish to Web link via email. You can use this link to add the report to your portfolio or share it publicly online.
All validated entries will also receive personalized feedback from the evaluation team via email within 1-2 business days. Use this feedback to revise your report and resubmit it before the deadline.
Note: Feel free to resubmit your entry as many times as necessary before the deadline.
5. Finalize your participation to compete for the prize
Share a LinkedIn post on your profile with your Power BI project image, including the tags @ZoomCharts and @OnyxData, as well as the hashtags #dataDNA and #builtwithzoomcharts.
After posting the report on LinkedIn, please submit it to the Onyx Data DataDNA Main Challenge for a chance to compete for all prizes.
6. Attend challenge closing webinar to hear the results:
The submissions are evaluated by ZoomCharts team (see "Judging criteria" for more info). The submissions of Top 5 ZoomCharts Mini Challenge finalists are analyzed live during the challenge closing webinar to share the best practices and learning opportunities with the community.
The author of the best report is rewarded with a $300 Amazon gift card from ZoomCharts.
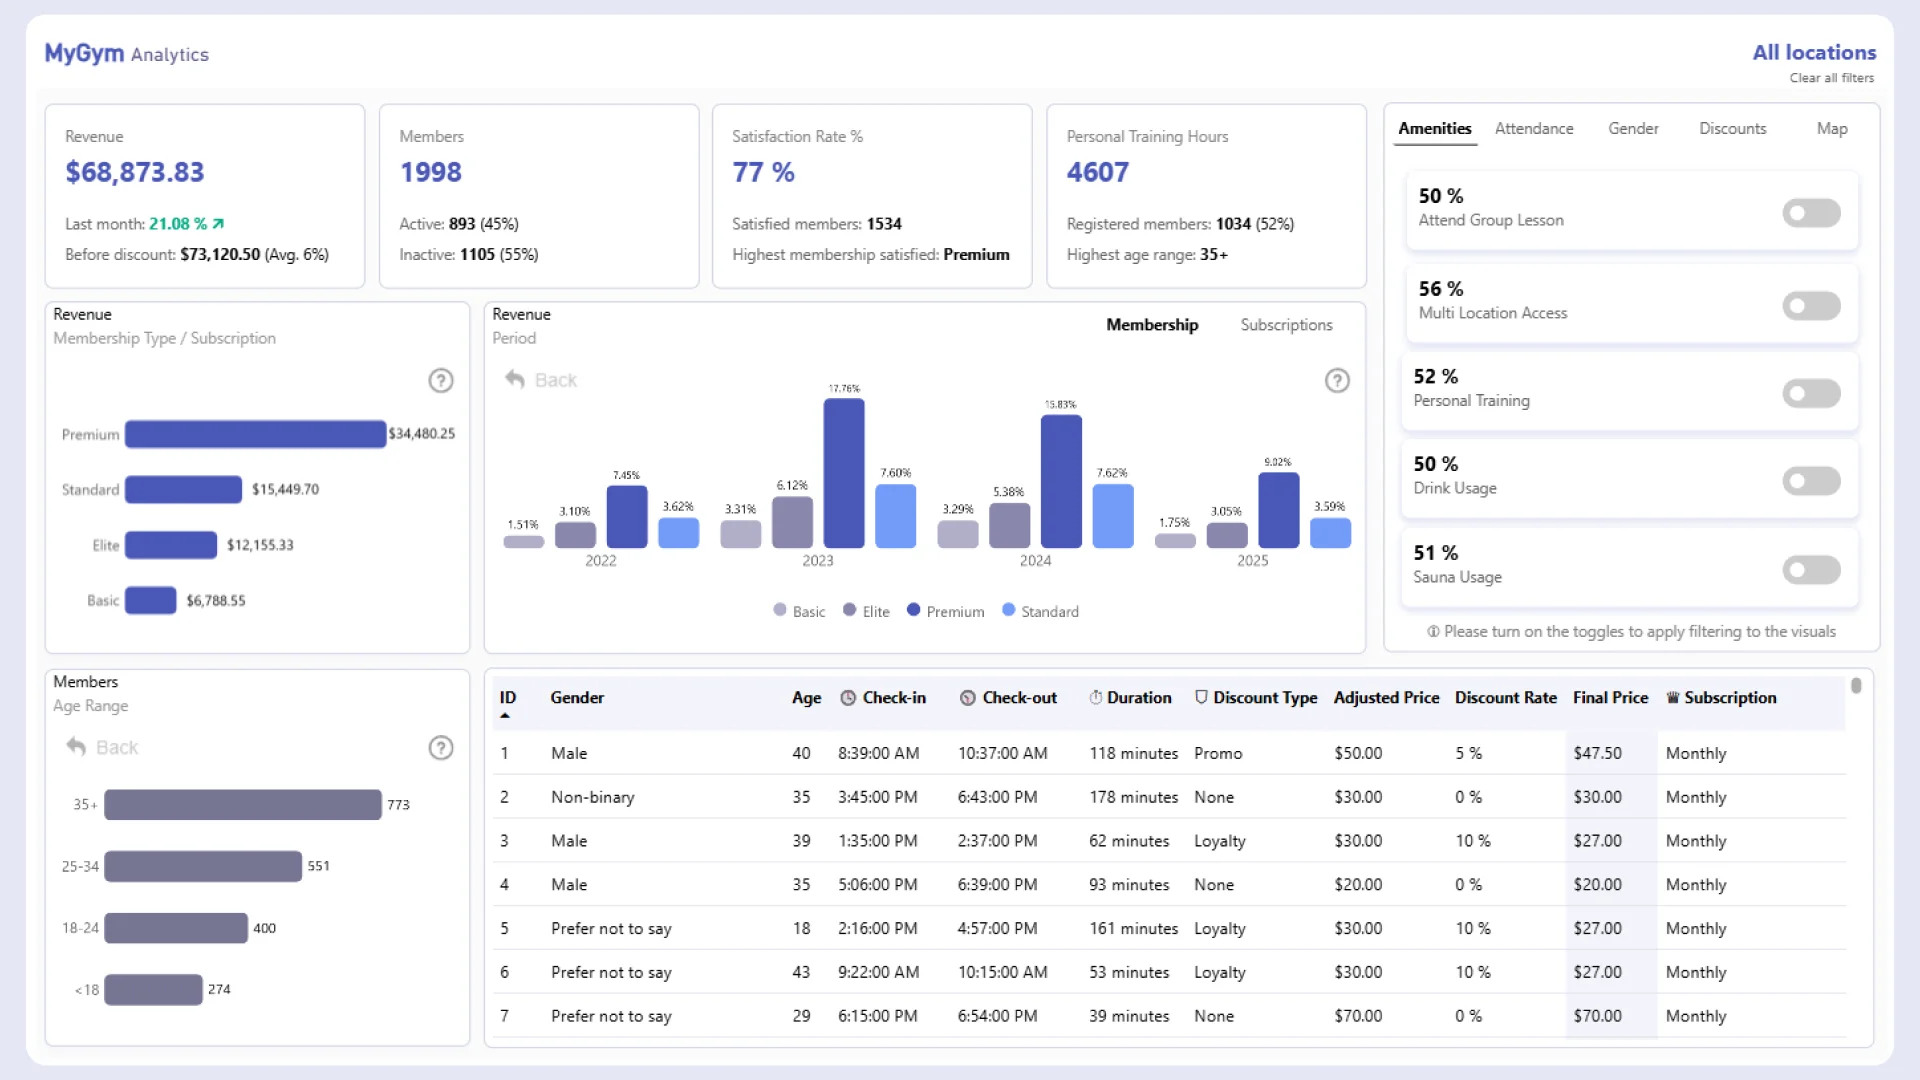
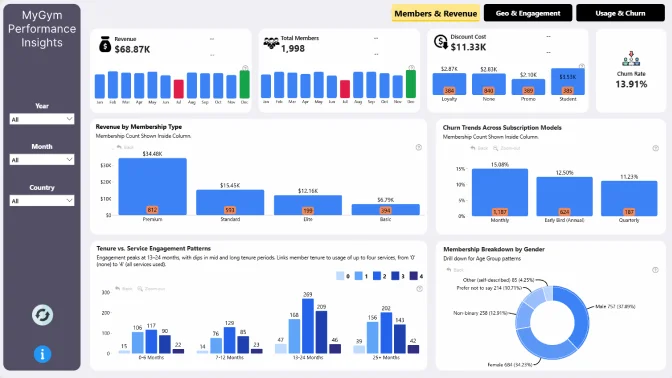
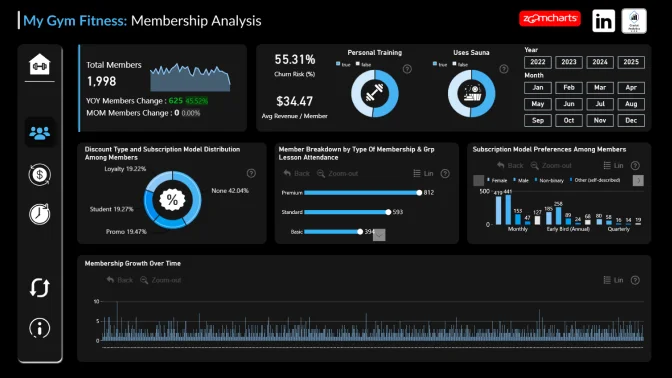
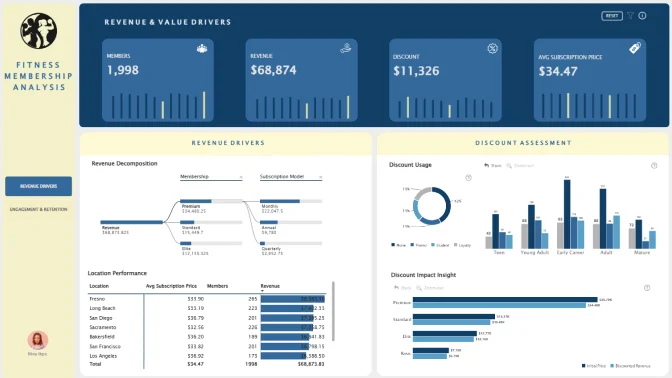
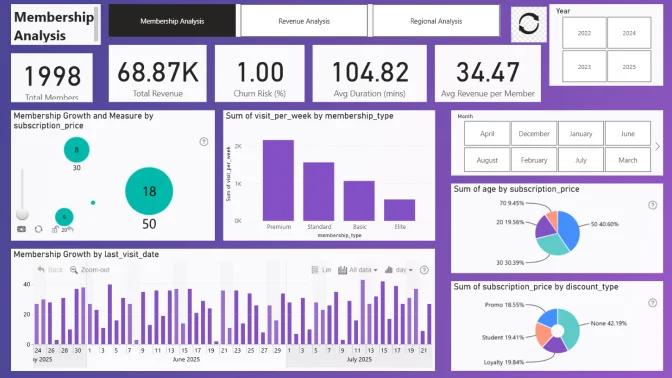
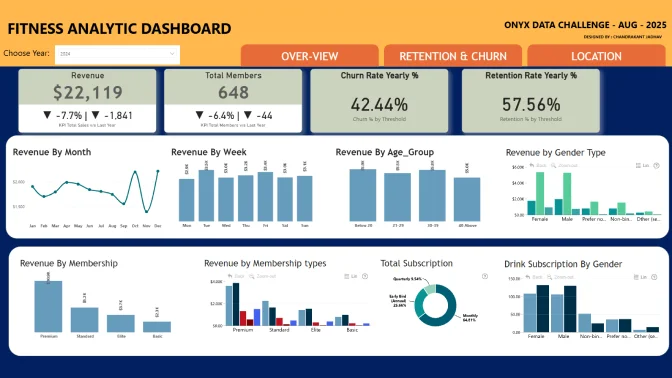
Fitness Membership Analytics Challenge
Optimize Retention, Revenue, and Engagement
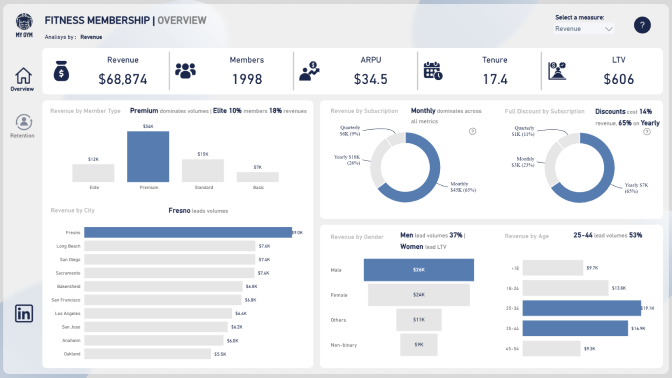
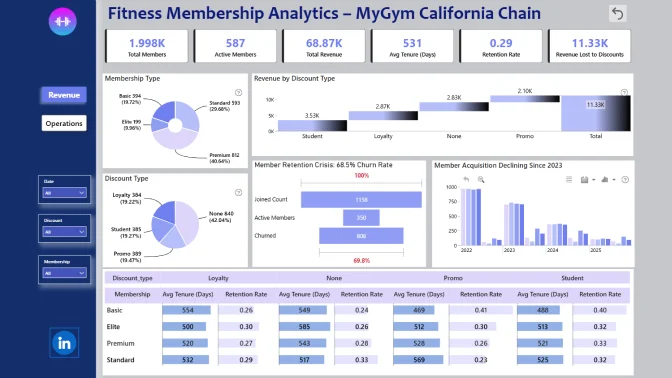
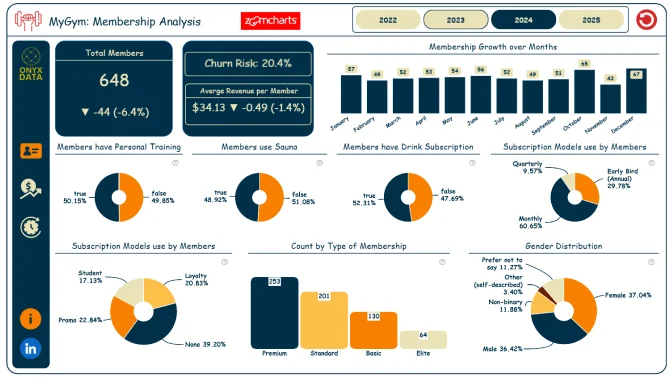
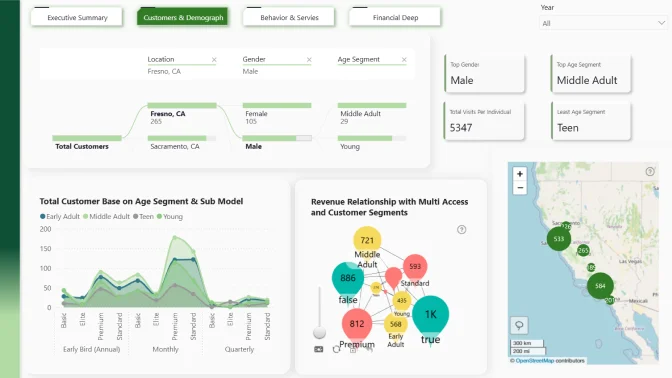
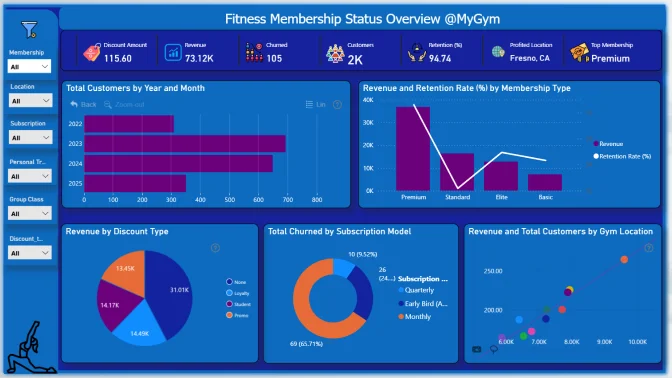
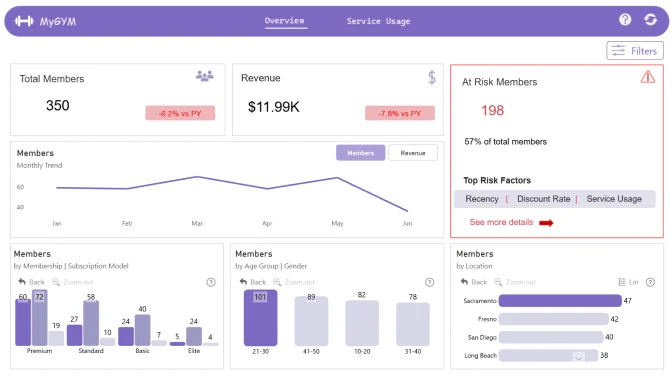
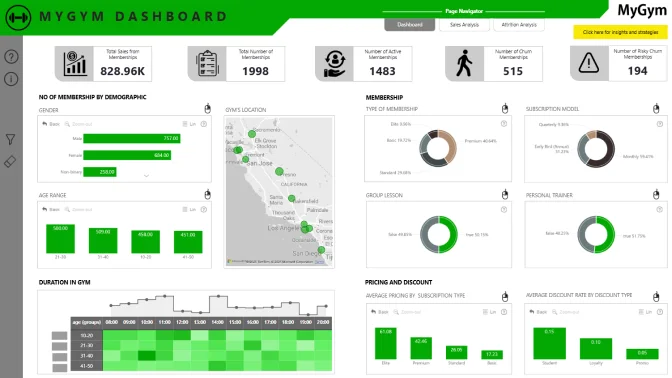
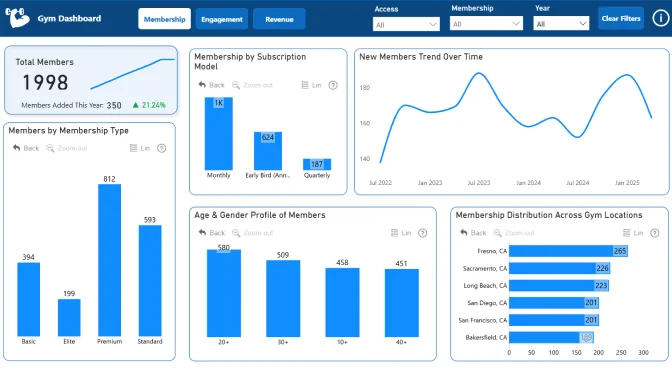
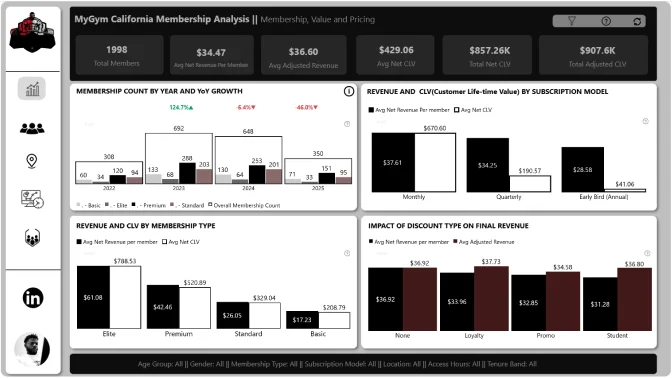
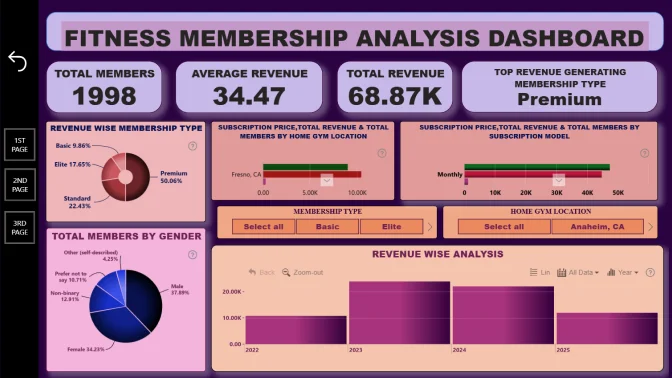
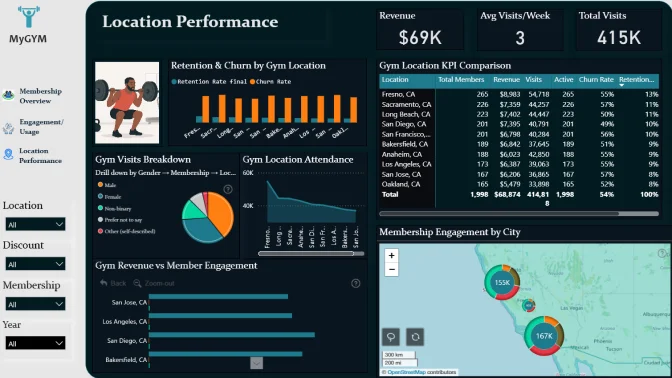
In this challenge, you’ll take on the role of a data analyst at MyGym, a fast-growing fitness center chain with multiple locations across California. MyGym offers a wide range of membership tiers, subscription models, and amenities, including group classes, personal training, and multi-location access.
Gaining insights into how members engage with these services is crucial for optimizing operations and designing targeted, effective membership offers.
Use this dataset to develop an analytical report or dashboard that helps MyGym:
Understand which member segments bring the most value
Identify areas for pricing, subscription, or service optimization
Improve customer experience through data-driven insights
Optimize staffing and facility allocation across locations
Explore trends in retention, usage, and upgrade behavior
Questions to Explore:
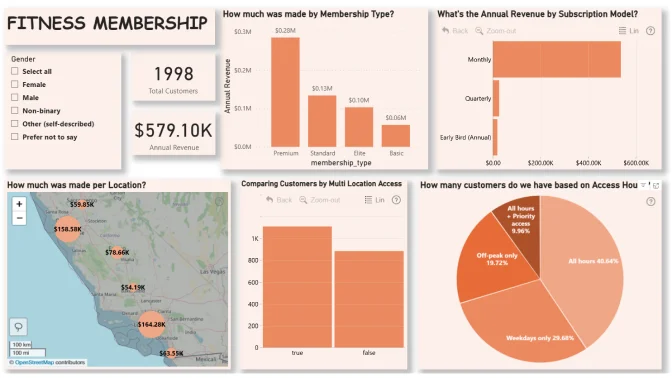
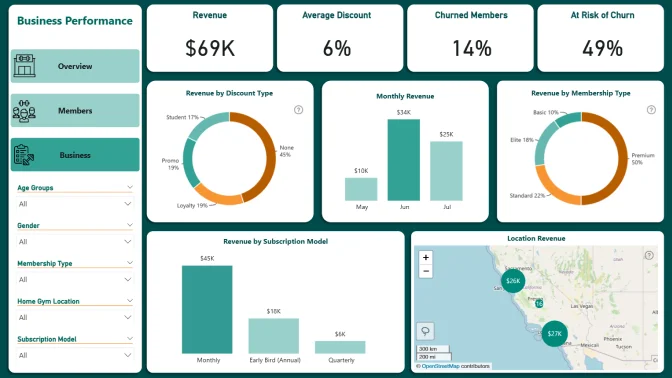
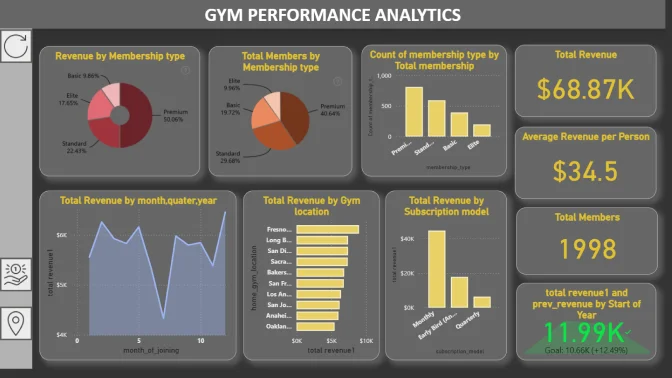
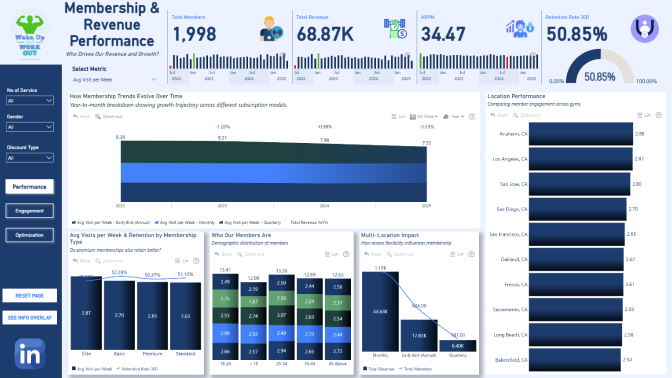
Which membership types are linked to the highest retention or revenue?
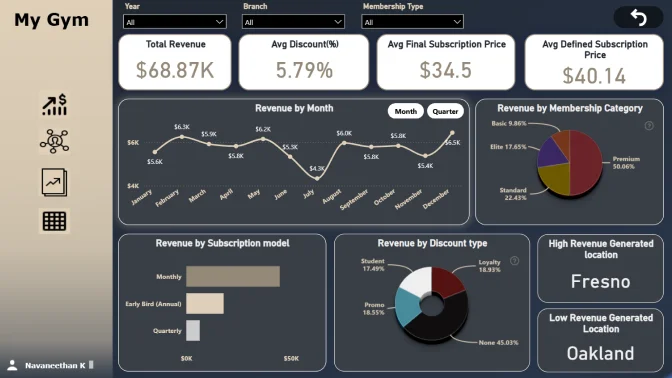
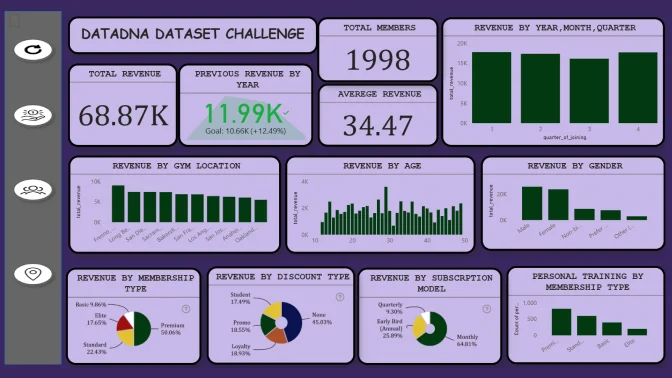
Do pricing models (e.g., monthly vs. early bird annual) affect churn or satisfaction?
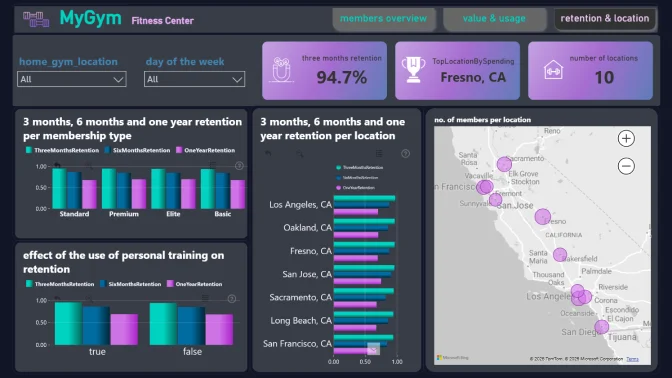
Are some locations performing better than others in terms of engagement or profitability?
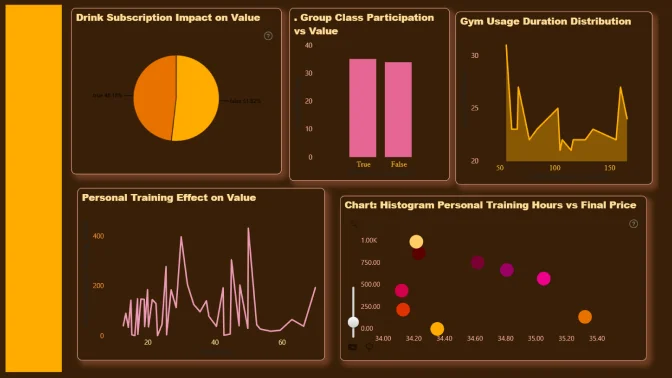
How does personal training usage or group class participation influence value?
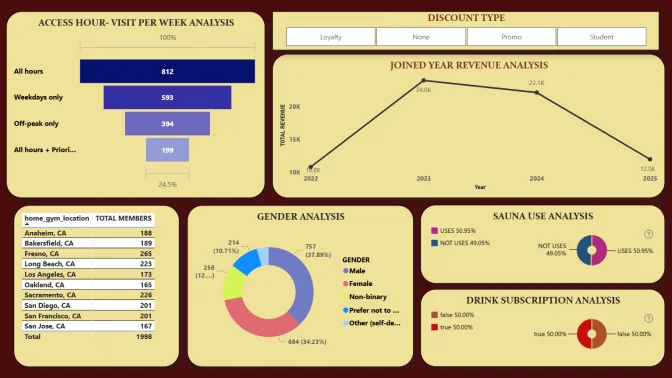
What effect do discount types (promo, student, loyalty) have on final revenue?
Is there a relationship between tenure and service usage or upgrade behavior?
Do certain access types (off-peak, all hours, priority) impact visit frequency?
What geographic patterns emerge from multi-location access behavior?
How do different customer segments use the gym throughout the week?
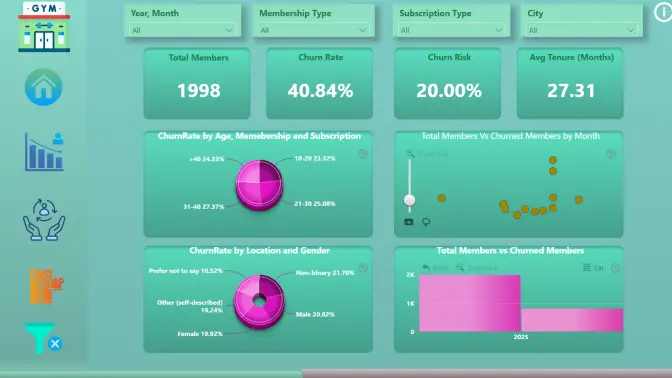
Can you identify clusters of high-value members or potential churn risks?
P.S. These are exploration prompts, not a checklist. Feel free to go beyond them and uncover unexpected patterns.
Technical requirements
Build your report using only Power BI
The number of pages in the report is not limited
At least one report page has to contain a minimum of 2 ZoomCharts Drill Down Visuals. See a practical guide on Drill Down Visuals here
Judging criteria
Each report is evaluated based on three main criteria: intuitiveness, insightfulness, and interactivity. These factors ensure that the reports are not only accurate and functional, but also meet the target audience's needs and are ready to be presented to the end-users.
Intuitive: How clear and easy it is to understand the report at a glance? (max 15 points)
Is the report visually appealing?
Choice of charts and visual elements
Does the report tell a story?
Is it not overwhelming to the user?
Choice of tooltips, titles, and legends
Interactive: How engaging and seamless is the report exploration and interaction with data? (max 15 points)
Clear navigation that allows user to explore the report
Use of slicers and other interactive elements
Smooth cross-chart integration
Is report optimized for touch devices?
Are tutorials and guiding elements helpful to the user?
Insightful: How accurate, complete, and meaningful is the data in driving decisions? (max 15 points)
Depth of analysis
Data cleaning and preparation
Does data show up accurately in the report?
Is report optimized for quicker loading time?
Does the report provide deeper exploration of data (drill-down)?
Use the email and password provided below to log in Power BI Desktop and access an account with a license to use all ZoomCharts Drill Down Visuals.
*This Developer License can be used to create a report for this ZoomCharts Mini Challenge or for your personal training purposes. Commercial use of this license is prohibited.
Any questions? Feel free to use chat!
Are you sure you want to delete the report?
Activate your Drill Down visuals Developer License!
You can use these credential to access ZoomCharts visuals and create your report for this ZoomCharts Mini Challenge, or for your personal training purposes.
Get ZoomCharts Developer License
Select this option if you already have a Microsoft work or school account to activate and use ZoomCharts visuals in Power BI Desktop.
Activate your free developer license to use Drill Down visuals in your challenge report.
Create a free Microsoft account
To install ZoomCharts visuals from the Power BI marketplace, you need a Microsoft account.
Don’t have a Microsoft account yet? Create a free account to build reports and join challenges.
warning
Error message
success
Success info: Done!
We noticed you're using an old OS version.
For the best experience, we recommend upgrading to ensure that all website features display correctly.
Cookie settings
We use necessary cookies for site functionality, as well as statistic, marketing, and preference cookies to enhance your experience. For more information and to manage your preferences, please visit our Cookie policy