logo
For Power BI
  • Products
    • Drill Down Donut Pro Drill Down Donut PRO
    • Drill Down Pie Pro Drill Down Pie PRO
    • Drill TimeSeries Pro Drill Down TimeSeries PRO
    • Drill Combo Pro Drill Down Combo PRO
    • Drill Map Pro Drill Down Map PRO
    • Drill Scatter Pro Drill Down Scatter PRO
    • Drill Down Network Pro Drill Down Network PRO
    • Drill Down Waterfall Pro Drill Down Waterfall PRO
    • Drill Down Graph Pro Drill Down Graph PRO
    • Drill Down Timeline Pro Drill Down Timeline PRO
    • Drill Down Combo Bar PRO Drill Down Combo Bar PRO

    Video tutorials

    Watch Now

    More than 90 videos on how to enhance Power BI with ZoomCharts

    Learn more
    All visuals
  • Resources

      Resources

    • Documentation
    • Report Examples
    • Blog
    • Webinars
    • Video Tutorials
    • Visuals Gallery

    Support

    • ZoomCharts Assistance
    • Contact Sales
    • Contact Support
    • FAQ

    Challenges

    Challenges

    Improve your report creation skills by participating in free challenges for report creators.

    Learn more
    Start trial
  • Services
    • Power BI Report Development
    • Custom Visual Development
  • Challenges
  • Pricing
Request a quote Start Free Book a Demo Sign in
Get it now
Go back

Contents

Go back

Share

Logo

Welcome to the FP20 Analytics May 2025 Challenge!

Apr 30 - May 27, 2025 | EDT

Join Challenge 26 and create a Power BI report to analyze the company's Financial Statements.

Submission deadline

00

DAYS

00

HOURS

00

MINUTES

00

SECONDS

Sign in or sign up to continue

Make sure you provide an email address that you check regularly.


Already have an account? Sign in!

Login options

Register for the FP20 Analytics ZoomCharts Challenge!


Activate your Drill Down visuals Developer License!

Use these credentials to access ZoomCharts visuals and create your report for the ZoomCharts Challenge or for your personal training.


Ready to submit your report for review?

Thank you! Your report has been submitted!

Submitted:

Your report will undergo validation. Once the validation of your report is complete, we will send you a Power BI Publish to Web link that you can share publicly.

Confirmed your submission fits the criteria:

Reviewed:

Rejection reason:

Sorry, we are no longer accepting entries for this competition. Stay tuned for future events!

Something went wrong, please contact support!

Timeline

Registration Open

Registration Open

30 April | 11:00

-

Submissions Open

Submissions Open

30 April | 11:00

-

Workshop | Build a SaaS Financial Performance Power BI Dashboard

Workshop | Build a SaaS Financial Performance Power BI Dashboard

15 May | 09:00

-

1:1 Mentoring Sessions

1:1 Mentoring Sessions

15 May | 09:00

30 April - 21 May

Entry Submission Deadline

Entry Submission Deadline

21 May | 18:00

30 April - 21 May

Webinar | Top 5 Power BI Reports for Financial Statement Analysis

Webinar | Top 5 Power BI Reports for Financial Statement Analysis

27 May | 09:00

30 April - 21 May

Winner Announced

Winner Announced

27 May | 09:00

30 April - 21 May

Dataset

Get the dataset

Share the challenge

About challenge
How to participate
The Brief
Judging criteria
Timeline
Dataset
My license
Mentoring

About FP20 Analytics ZoomCharts Challenge

Want to learn to build PRO reports? With personalized feedback and informative workshops, this is your opportunity to take your report-building skills to the next level, build your professional portfolio, and network with like-minded people.

The ZoomCharts challenge is hosted in partnership with FP20 Analytics – a group that unites passionate and inspiring data enthusiasts, and helps new data analysts improve their skills and build a competitive portfolio. Join in and sharpen your skills together with this open and friendly data community. Read more about the challenges on the FP20 Analytics website. Join the community on LinkedIn.

Participate in FP20 Analytics ZoomCharts Challenge to enrich your skill in creating PRO reports that help business users explore data quickly and intuitively. 

  1. Free License: All participants receive a free ZoomCharts Developer License that gives access to the full Drill Down PRO visuals library. License will remain active for 1 year after the challenge.
  2. Learn from Experienced Professionals: As part of the challenge, we host live workshops on report building and visualizing the challenge’s dataset in Power BI. Challenge participants can also book an individual consultation with an experienced Power BI mentor to ask questions and get personalized tips.
  3. Tailored Feedback: Every challenge submission will receive personalized feedback, giving participants the chance to hone their skills and improve their reports.

Prizes

The best report’s creator will receive a $300 Amazon gift card from ZoomCharts. The ZoomCharts winner will be announced in a special live webinar session on April 29th, where we will review the Top 5 entries from the challenge. 

Webinars

Learn more about ZoomCharts visuals & gain a knowledge advantage in the contest by joining the upcoming webinars! You'll also get the chance to your ask questions and get expert answers in the Q&A section.

Upcoming webinars

Recording thumbnail

Build a SaaS Financial Performance Power BI Dashboard

15th May, 2025

09:00 AM - EDT

Learn how to analyze income, expenses, budget vs actuals, and revenue trends using a real financial dataset.

Learn more
Recording thumbnail

Top 5 Power BI Reports for Financial Statement Analysis

27th May, 2025

09:00 AM - EDT

Explore the best Power BI dashboards for financial reporting! Join us as we reveal this month’s Top 5 reports, share expert insights, and announce the winning entry that impressed the judges.

Learn more

How to participate? 

1. Register for the challenge: 

  • Download the Challenge dataset either on this Challenge page or from FP20 Analytics website. 
  • Register for the FP20 Analytics ZoomCharts Challenge. 
  • Activate your free Drill Down Visuals Developer License for Power BI. Read license setup instructions.
  • Read the challenge brief (see "The Brief" section) for additional info about the dataset and to see what questions your report should answer.  

2. Build your report in Power BI: 

  • Set up an account in Power BI using the assigned license details (if you have participated in ZoomCharts Challenges in the past, you can use the same account you set up before).
  • Use the account to access the full library of custom ZoomCharts Drill Down visuals. 
  • Use the dataset to build a Power BI report including at least 2 ZoomCharts Drill Down Visuals in one report page. 
  • The recommended number of pages in the report is up to 3 pages, including drill-through pages. 

3. Improve your report and learn new skills: 

  • To learn more about applying ZoomCharts visuals in your reports, participate in the challenge workshop. 
  • If you have any questions or need advice, you can book a free individual consultation. 
  • Check out the submissions from past challenges for inspiration. 

4. Submit your challenge entry: 

  • Submit your report in .pbix format for validation. 
  • If your submission doesn’t match the challenge criteria, you will be notified by email indicating the reason. Don't worry if this happens! You can fix the issue and resubmit your report. 
  • Together with validation confirmation, you will receive a publish to web link that you can use to add the report to your portfolio or publicly share online. 
  • All validated entries will receive personalized feedback from the evaluation team. You can use this feedback to revise your report and resubmit it before the deadline. Feel free to resubmit your entry as many times as necessary before the deadline. 

5. Finalize your participation to compete for the ZoomCharts grand prize: 

  • Post the final version of your submission in PDF format on your LinkedIn profile. 
  • Use the caption "I am participating in FP20 Analytics Challenge 25". 
  • Include a summary of your report's key insights and add the ZoomCharts publish to web link.
  • Use #FP20Analytics, #FP20InventoryManagementAnalysis, #builtwithzoomcharts, tag @Federico Pastor and @Zoomcharts.
  • Additionally, post your report in the FP20 Analytics LinkedIn Community group. 
  • Follow ZoomCharts on LinkedIn

6. Attend challenge closing webinar to hear the results: 

  • The submissions are evaluated by ZoomCharts team (see "Judging criteria" for more info). The submissions of Top 5 ZoomCharts Challenge finalists are analyzed live during the challenge closing webinar to share the best practices and learning opportunities with the community. 
  • The author of the best report is awarded with a $300 Amazon gift card.

Technical requirements

  • Build your report using only Power BI 
  • The recommended number of pages in the report is up to 3 pages, including drill-through pages.
  • Canvas size is 16:9 (Default Power BI size) or Full HD size = w:1920 - h:1080 
  • The report should contain at least 2 ZoomCharts Drill Down visuals within a single page. See a practical guide for using Drill Down visuals here


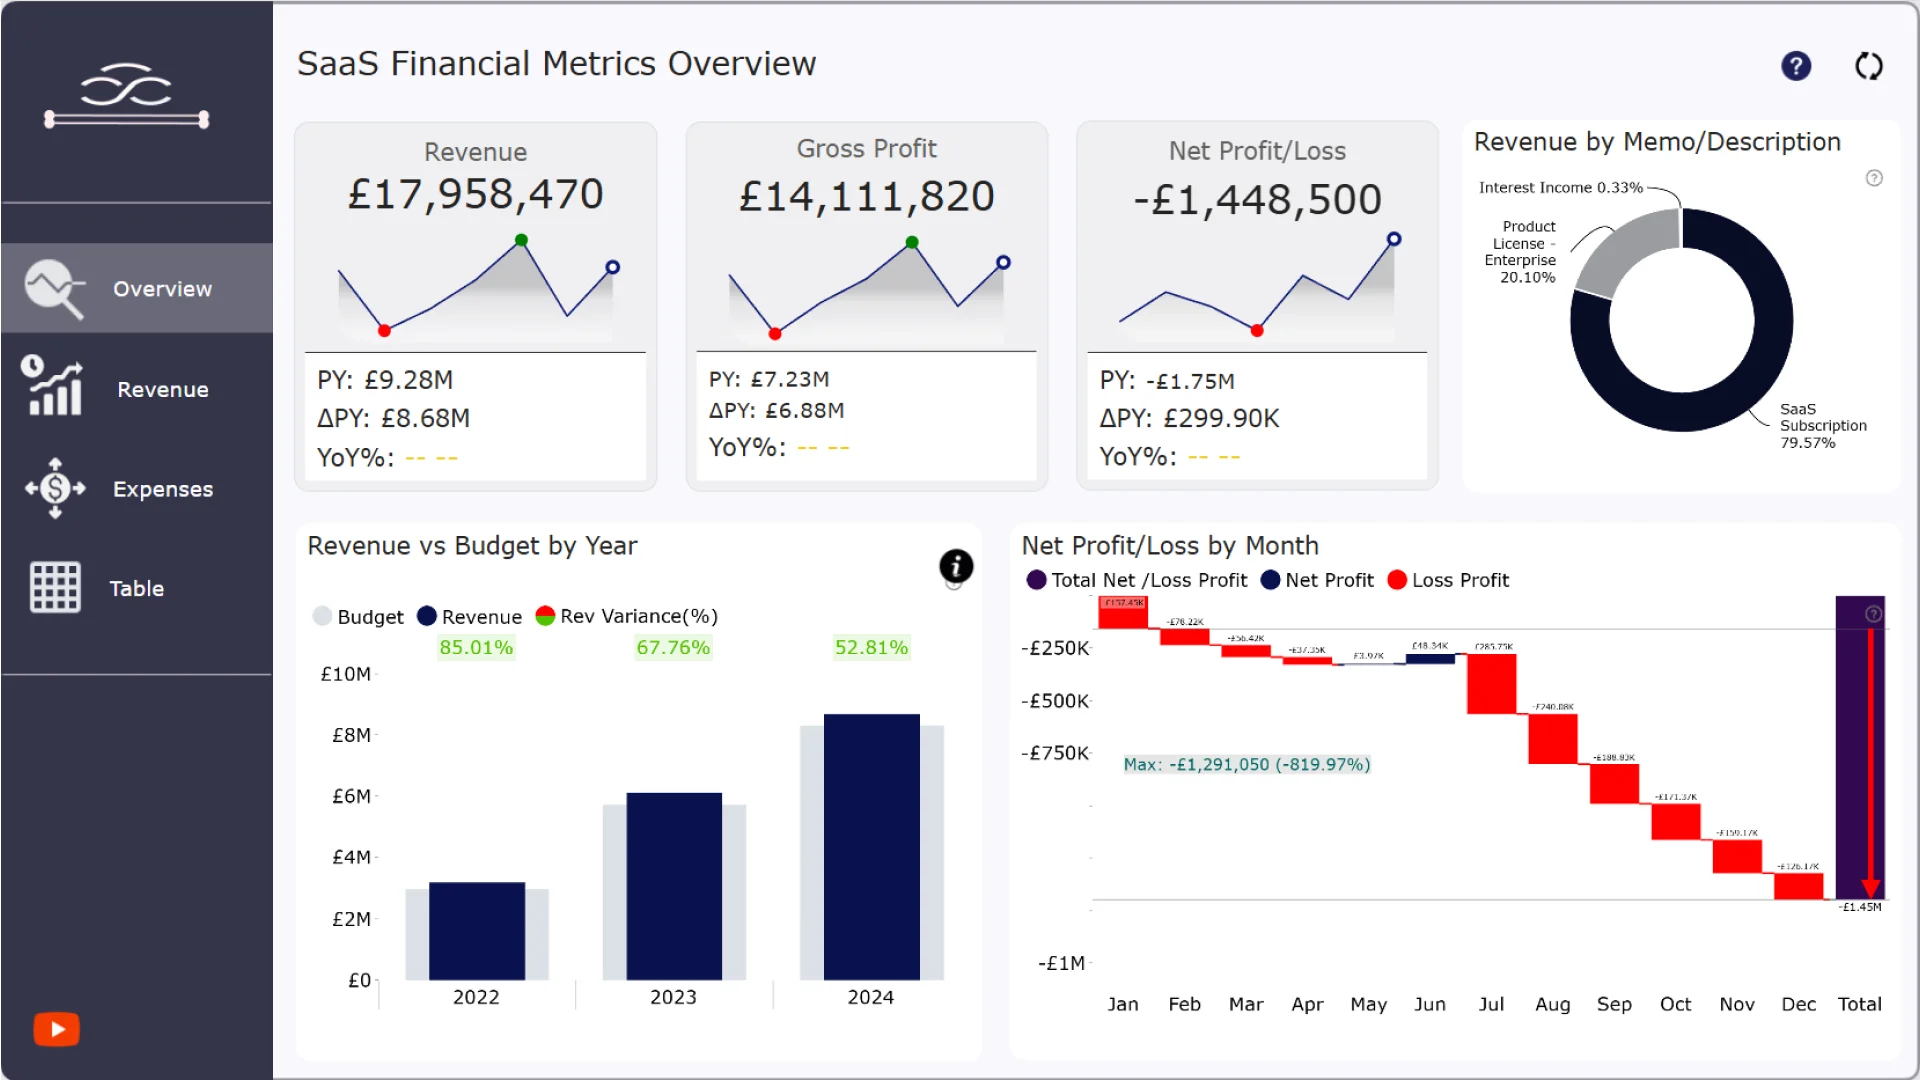
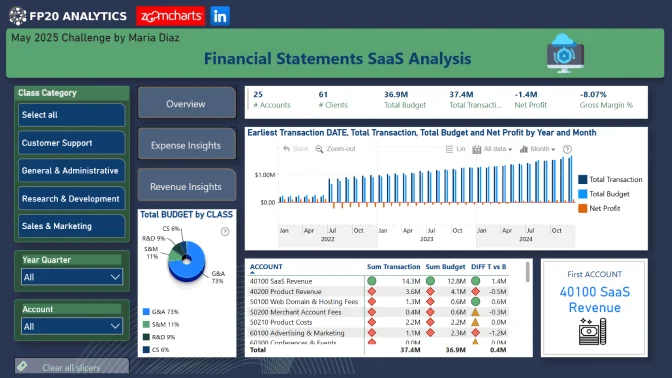
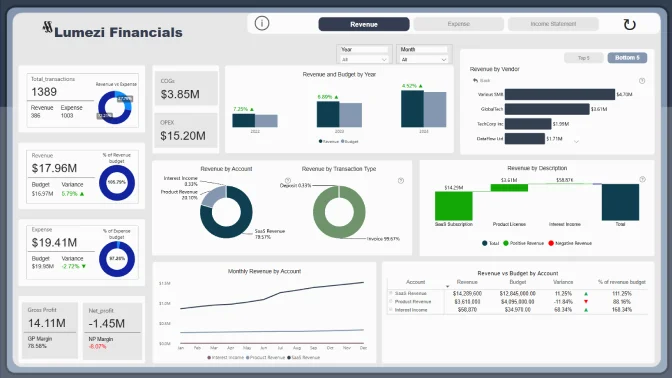
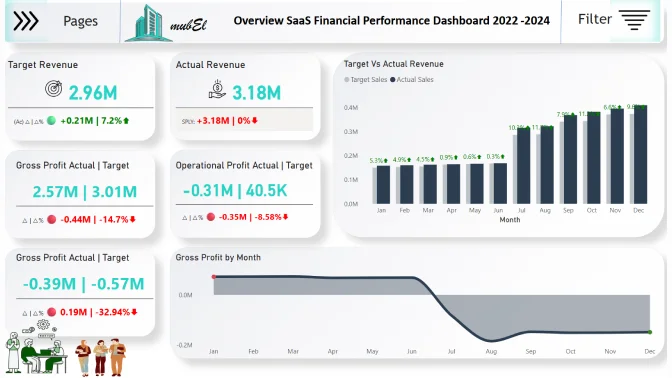
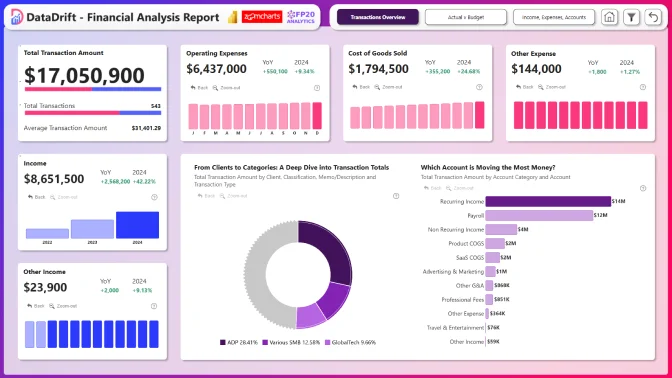
Welcome to the Financial Statements Challenge!

In this challenge, you’re tasked with analyzing the financial data of a single SaaS (Software-as-a-Service) company. The dataset includes two key components:
- A detailed transaction history of real income and expenses
- A structured budget plan that sets financial expectations

Challenge Questions: 

The questions below are designed to help you explore different aspects of the company’s financial performance. They’re not requirements, they’re here to guide your thinking and help you focus your analysis.

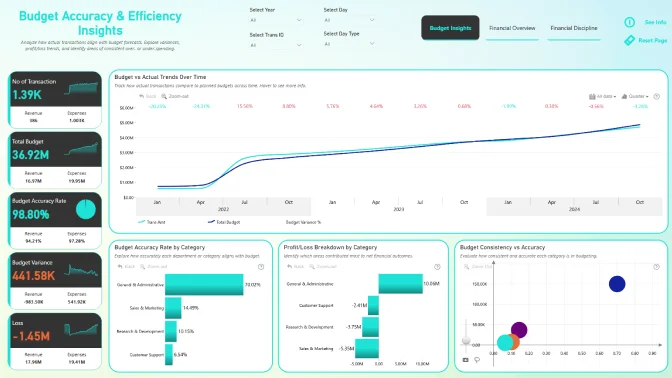
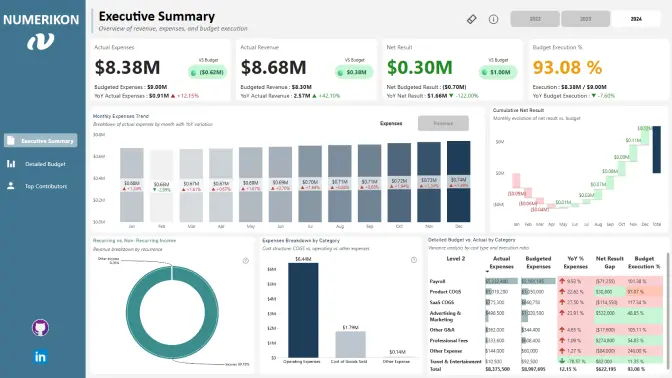
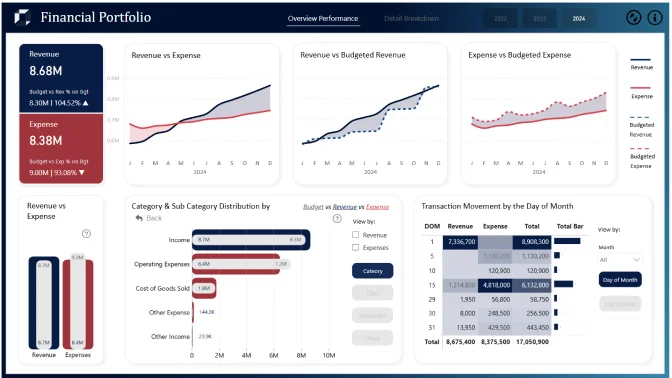
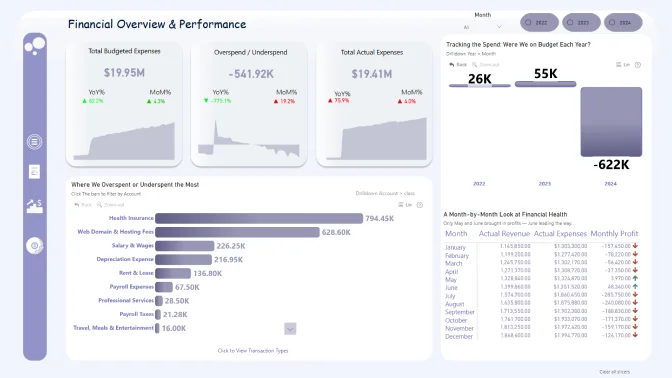
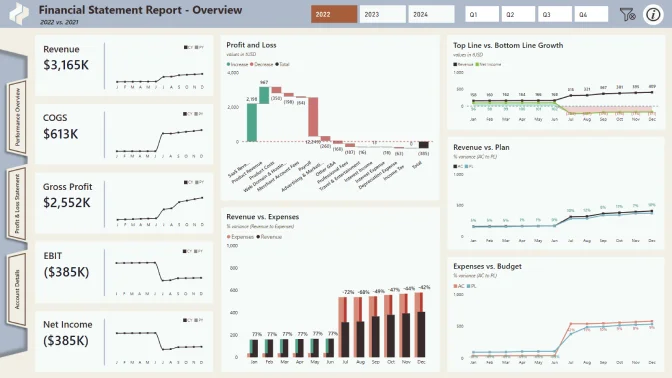
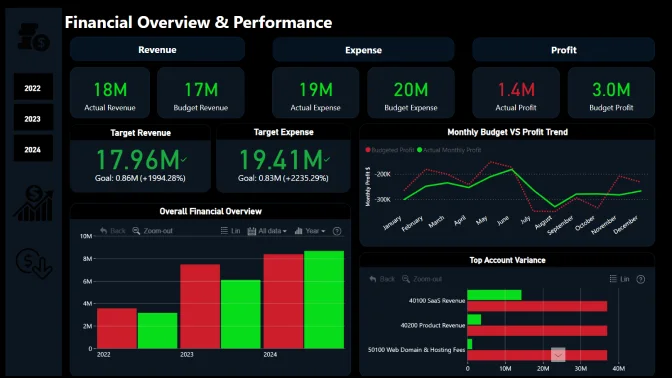
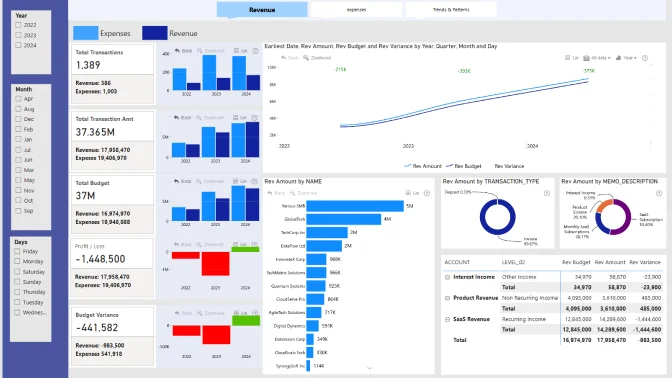
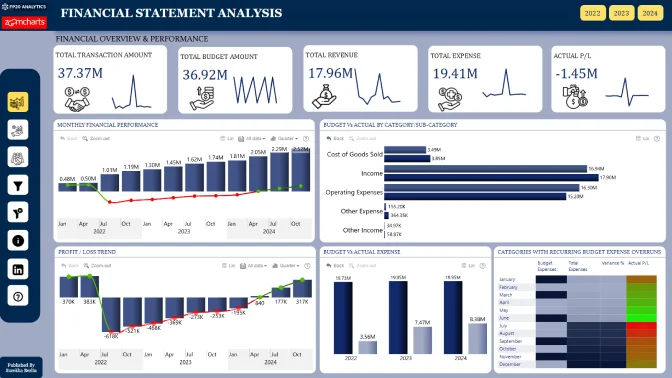
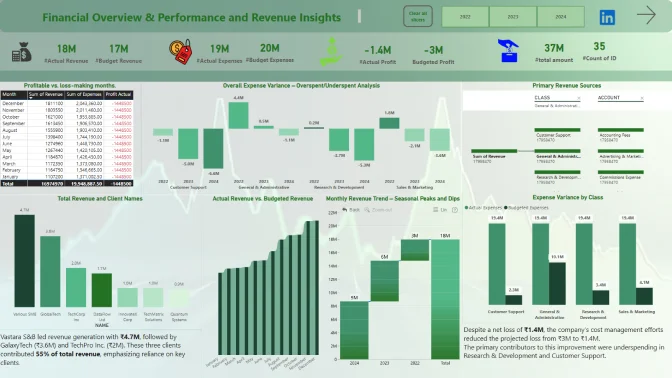
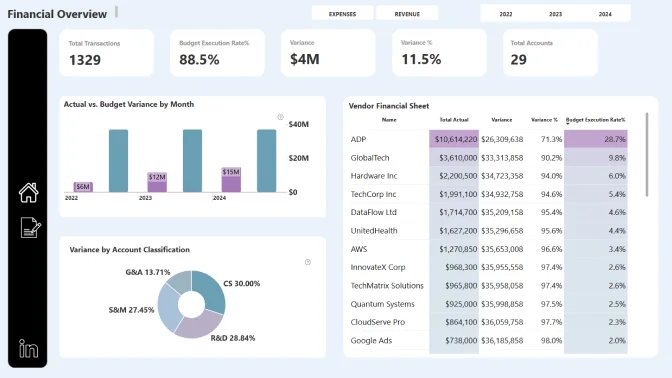
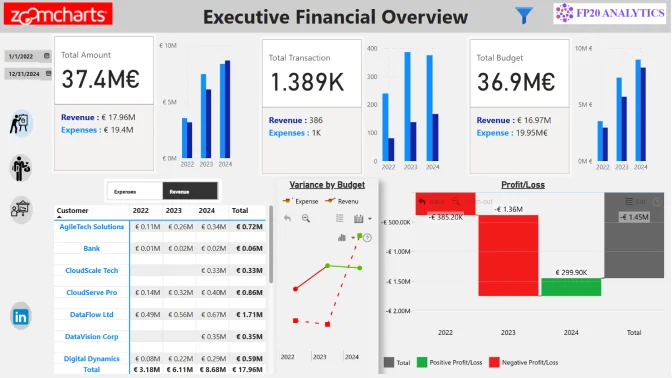
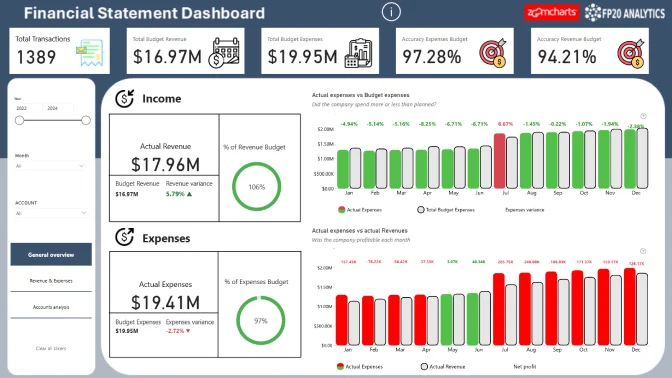
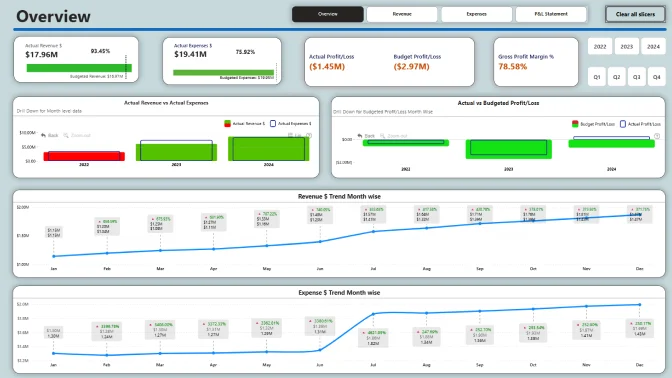
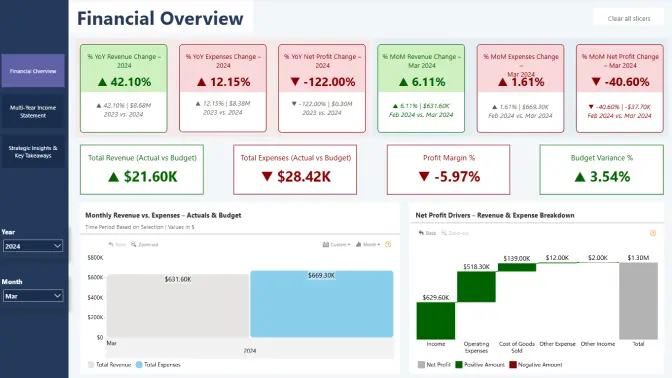
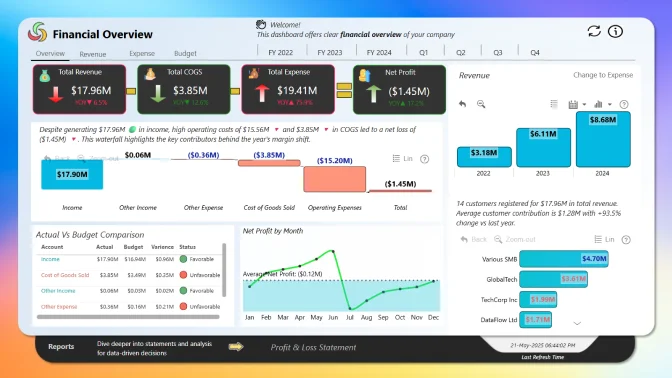
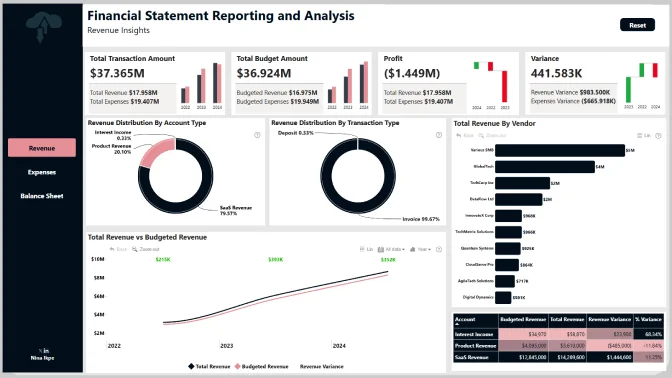
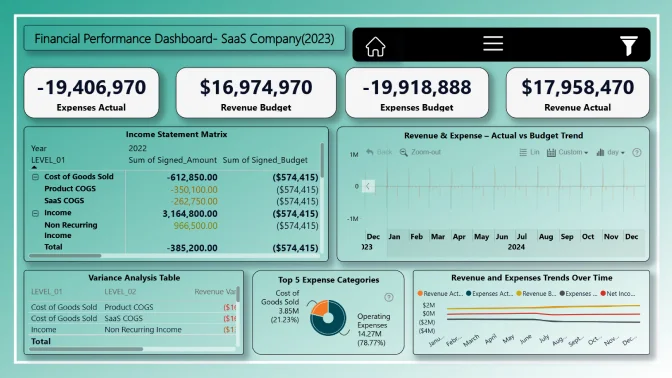
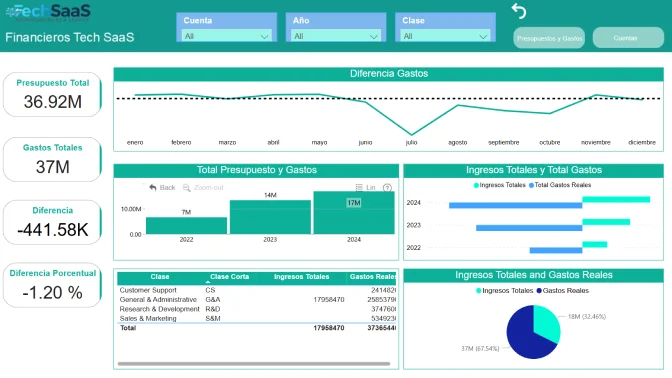
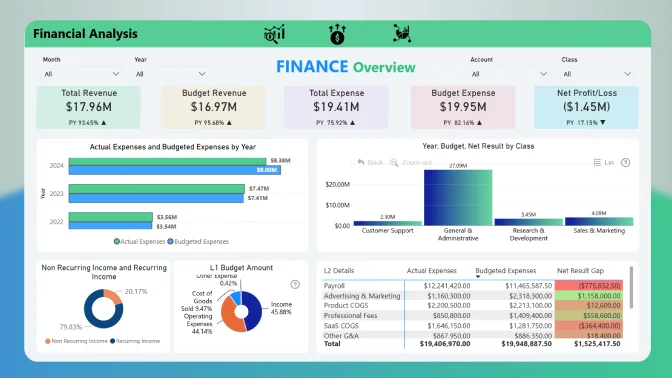
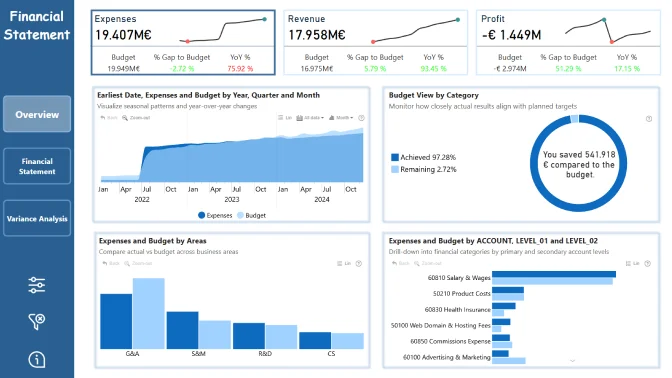
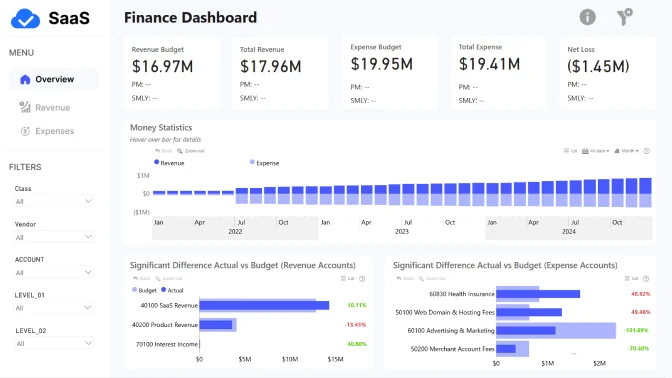
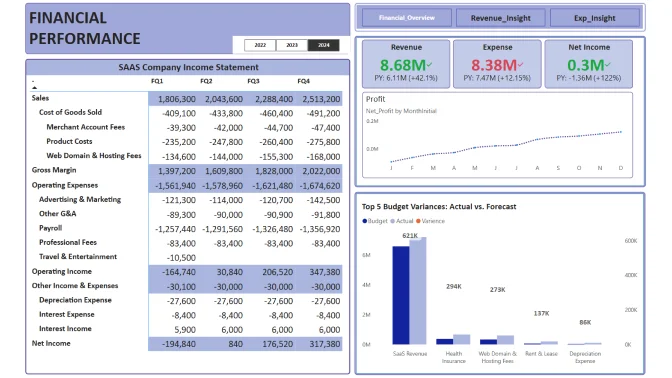
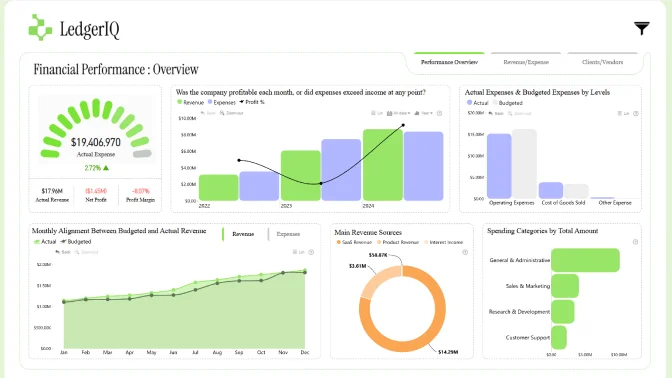
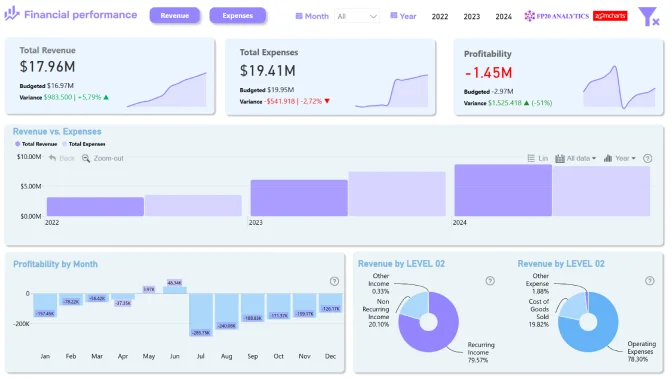
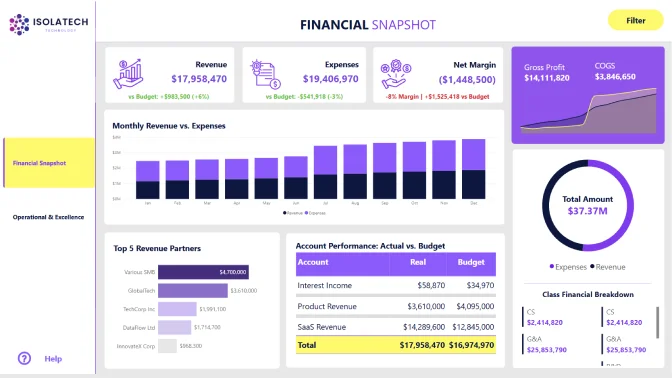
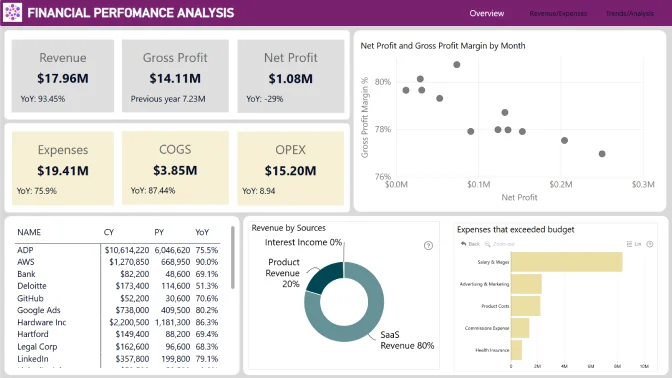
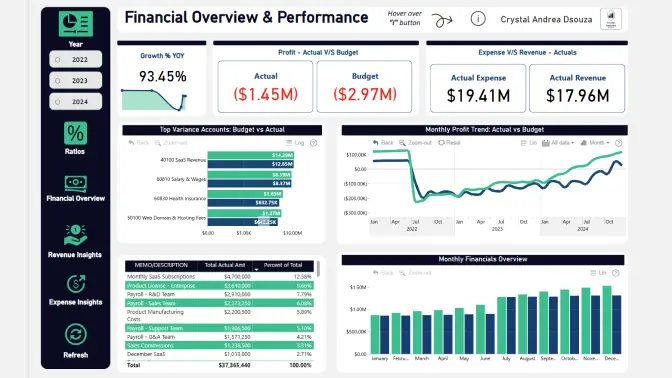
Financial Overview & Performance
  • Over the year, did the company spend more or less than planned?
  • Was the company profitable each month, or did expenses exceed income at any point?
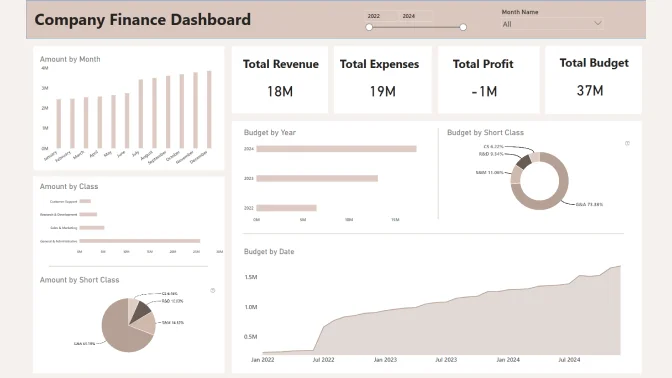
  • Which categories or accounts show the largest difference between budget and actual figures?
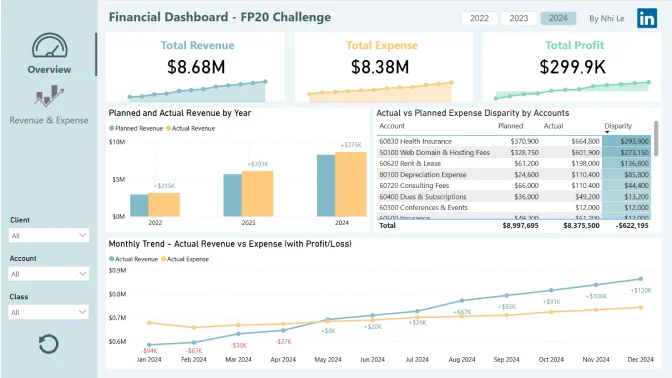
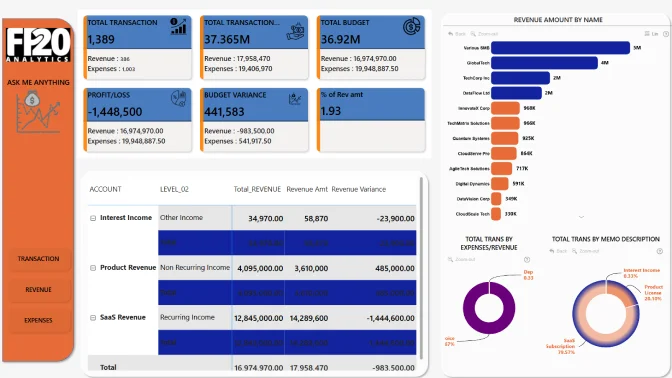
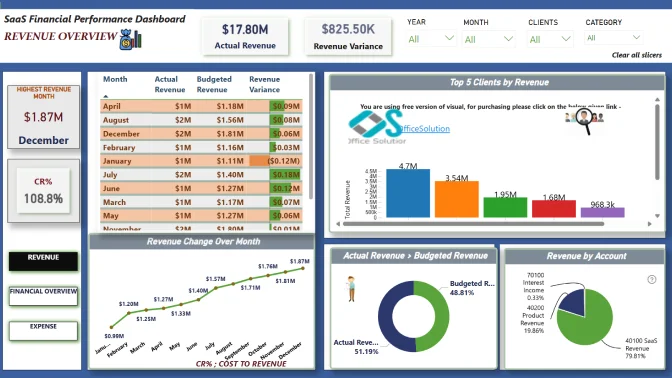
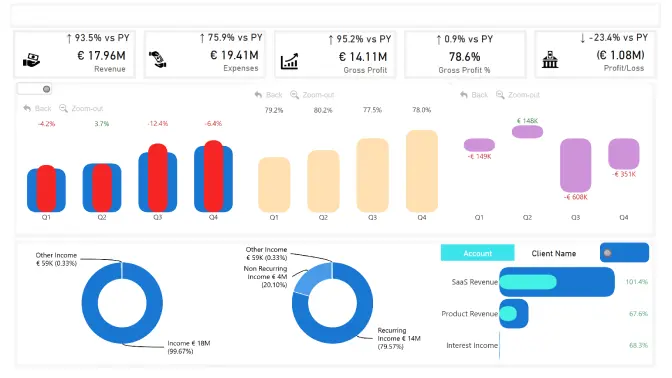
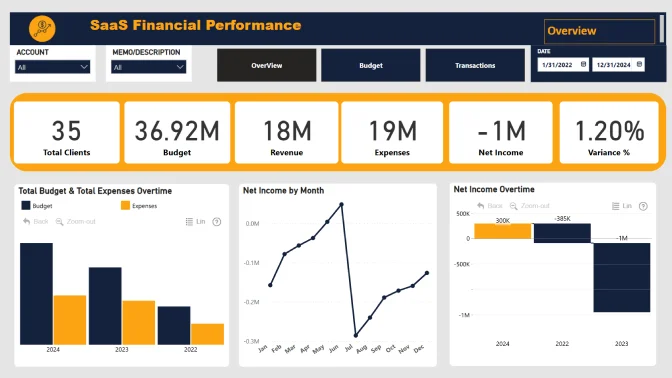
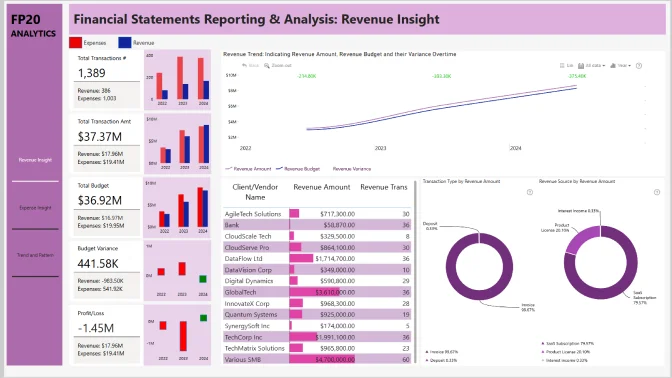
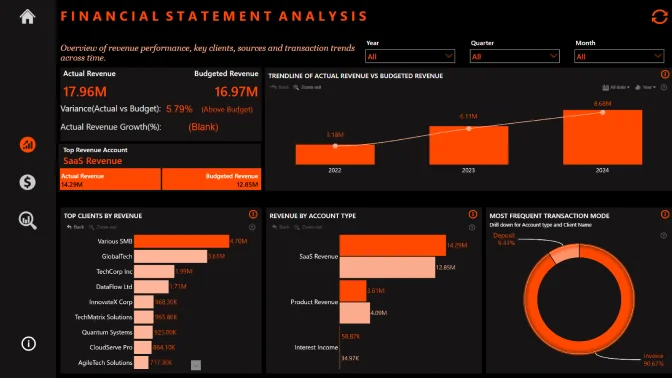
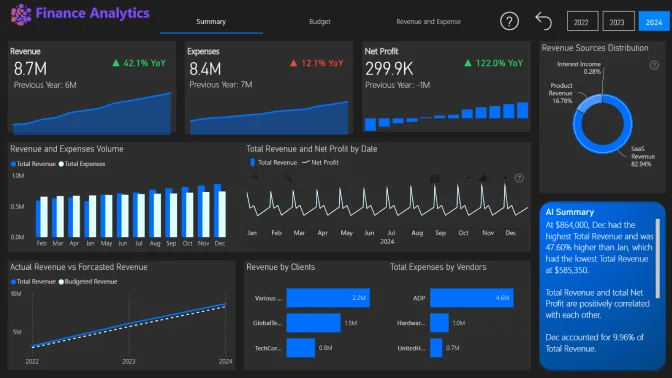
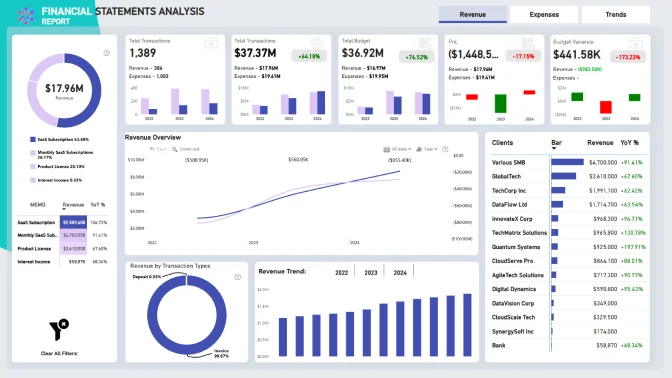
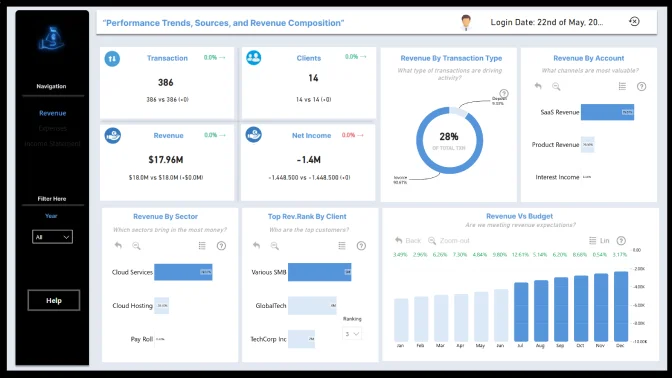
Revenue Insights
  • What are the main revenue sources, and which one generates the most income?
  • How does revenue change over time — are there any seasonal peaks or slowdowns?
  • Which clients or deals brought in the highest individual payments?
  • Were there specific months when revenue was noticeably lower than planned?
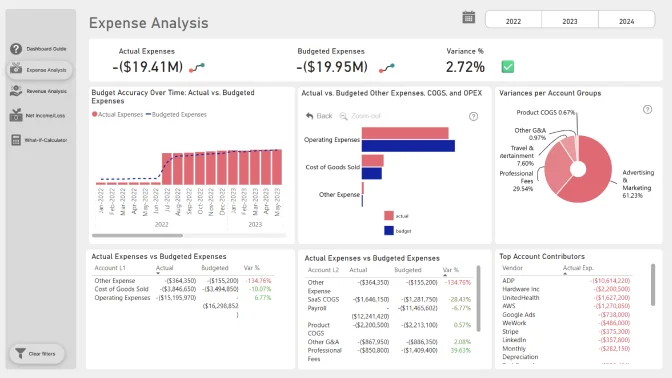
Expense Insights
  • What are the top 5 spending categories by total amount?
  • Which vendors or service providers (e.g., AWS, Stripe) received the most money overall?
  • Are there any expense categories that regularly exceeded their budget?
  • In which months did spending increase sharply, and what caused it?
Trends & Patterns
  • Are there any repeating monthly or seasonal patterns in revenue or spending?
  • Which months show the best alignment between budgeted and actual figures?

Judging criteria

Business users use reports to make data-driven decisions. That’s why reports are called effective if they enable users to drill down and filter data quickly and intuitively to find answers to any question they might have and analyse data in all possible directions and dimensions.

Each report is evaluated based on three main criteria: intuitiveness, insightfulness, and interactivity. These factors ensure that the reports are not only accurate and functional, but also meet the target audience's needs and are ready to be presented to the end-users. 

  1. Intuitive: How clear and easy it is to understand the report at a glance? (max 15 points)
    • Is the report visually appealing?
    • Choice of charts and visual elements
    • Does the report tell a story?
    • Is it not overwhelming to the user?
    • Choice of tooltips, titles, and legends

  2. Interactive: How engaging and seamless is the report exploration and interaction with data? (max 15 points)
    • Clear navigation that allows user to explore the report
    • Use of slicers and other interactive elements
    • Smooth cross-chart integration
    • Is report optimized for touch devices?
    • Are tutorials and guiding elements helpful to the user?

  3. Insightful: How accurate, complete, and meaningful is the data in driving decisions? (max 15 points)
    • Depth of analysis
    • Data cleaning and preparation
    • Does data show up accurately in the report?
    • Is report optimized for quicker loading time?
    • Does the report provide deeper exploration of data (drill-down)?

Timeline

Registration Open

Registration Open

30 April | 11:00

-

Submissions Open

Submissions Open

30 April | 11:00

-

Workshop | Build a SaaS Financial Performance Power BI Dashboard

Workshop | Build a SaaS Financial Performance Power BI Dashboard

15 May | 09:00

-

1:1 Mentoring Sessions

1:1 Mentoring Sessions

15 May | 09:00

30 April - 21 May

Entry Submission Deadline

Entry Submission Deadline

21 May | 18:00

30 April - 21 May

Webinar | Top 5 Power BI Reports for Financial Statement Analysis

Webinar | Top 5 Power BI Reports for Financial Statement Analysis

27 May | 09:00

30 April - 21 May

Winner Announced

Winner Announced

27 May | 09:00

30 April - 21 May

Dataset

Get the dataset

My license

1:1 mentoring sessions

You can book a personal session with Senior Product Expert at ZoomCharts, Aivis Pavlovs, to gain practical knowledge about Drill Down Visuals and how they can be used to enhance data storytelling in a report.

Book a meeting

Your Drill Down Visuals Developers License

Use the email and password provided below to log in Power BI Desktop and access an account with a license to use all ZoomCharts Drill Down Visuals.

Upon logging in, you will need to change your password and enable two-factor authentication. If you encounter any problems, feel free to reach out to us via chat. For more information click here.

*This Developer License can be used to create a report for this ZoomCharts Mini Challenge or for your personal training purposes. Commercial use of this license is prohibited.

Submit your report to the FP20 Analytics ZoomCharts Challenge!

Enter your submission by attaching the Power BI report file. Your report will be published on the web, and we will e-mail you a link to your report that you can share publicly.

Upload failed
Attach file
File requirements: 16MB
warning If you are experiencing trouble with uploading your report, please send it in .pbix format along with all required information to [email protected]


Any questions? Reach out to us at [email protected]!

Are you sure you want to delete the report?

Activate your Drill Down visuals Developer License!

You can use these credential to access ZoomCharts visuals and create your report for this ZoomCharts Mini Challenge, or for your personal training purposes.


Invalid email address

Unfortunately, we couldn't reach the email address linked to this profile "". If you wish to receive news, feedback, and the Publish to Web link for your contest submissions, you'll need to create a new ZoomCharts account with a valid email address, or log into an existing account.

Switch account
logo
[email protected]
+44 204 577 3993
logo

Products

Drill Down Network PRO Drill Down Waterfall PRO Drill Down Graph PRO Drill Down Combo PRO Drill Down Combo Bar PRO Drill Down Donut PRO Drill Down Pie PRO Drill Down TimeSeries PRO Drill Down Timeline PRO Drill Down Map PRO Drill Down Scatter PRO All Visuals

Resources

Report Examples Webinars Blog ZoomCharts Academy Visuals Gallery Documentation Custom Visual Development Subscribe to News

Solutions

Custom Visual Development

Company

Pricing About Us Partners Leave feedback Join PowerGroup EU Funding

Help

ZoomCharts Assistance Contact Sales Contact Support FAQ

Drill Down Network PRO Drill Down Waterfall PRO Drill Down Graph PRO Drill Down Combo PRO Drill Down Combo Bar PRO Drill Down Donut PRO Drill Down Pie PRO Drill Down TimeSeries PRO Drill Down Timeline PRO Drill Down Map PRO Drill Down Scatter PRO All Visuals

Report Examples Webinars Blog ZoomCharts Academy Visuals Gallery Documentation Custom Visual Development Subscribe to News

Custom Visual Development

Pricing About Us Partners Leave feedback Join PowerGroup EU Funding

ZoomCharts Assistance Contact Sales Contact Support FAQ
+44 204 577 3993
[email protected]

Ready to get in touch?

Contact our experts with any question about Power BI and ZoomCharts for Free!

Contact us

© 2025, Data Visualization Software Lab

U.S. Patents No. 11,645,343; 11,921,804

Cookies Policy
Manage cookies
Privacy Policy
Global
EULA
Patent
warning

Error message

success

Success info: Done!

ZoomCharts AI Assistant

We noticed you're using an old OS version.

For the best experience, we recommend upgrading to ensure that all website features display correctly.

Cookie settings

We use necessary cookies for site functionality, as well as statistic, marketing, and preference cookies to enhance your experience. For more information and to manage your preferences, please visit our Cookie policy