Registration Open
Registration Open
12 January | 03:00
-
Reset your password
We'll email you instructions on how to reset your password
In this challenge, you step into the role of a data governance analyst working within a large, multi-domain organization. Build a Power BI report, and compete for a $300 prize.
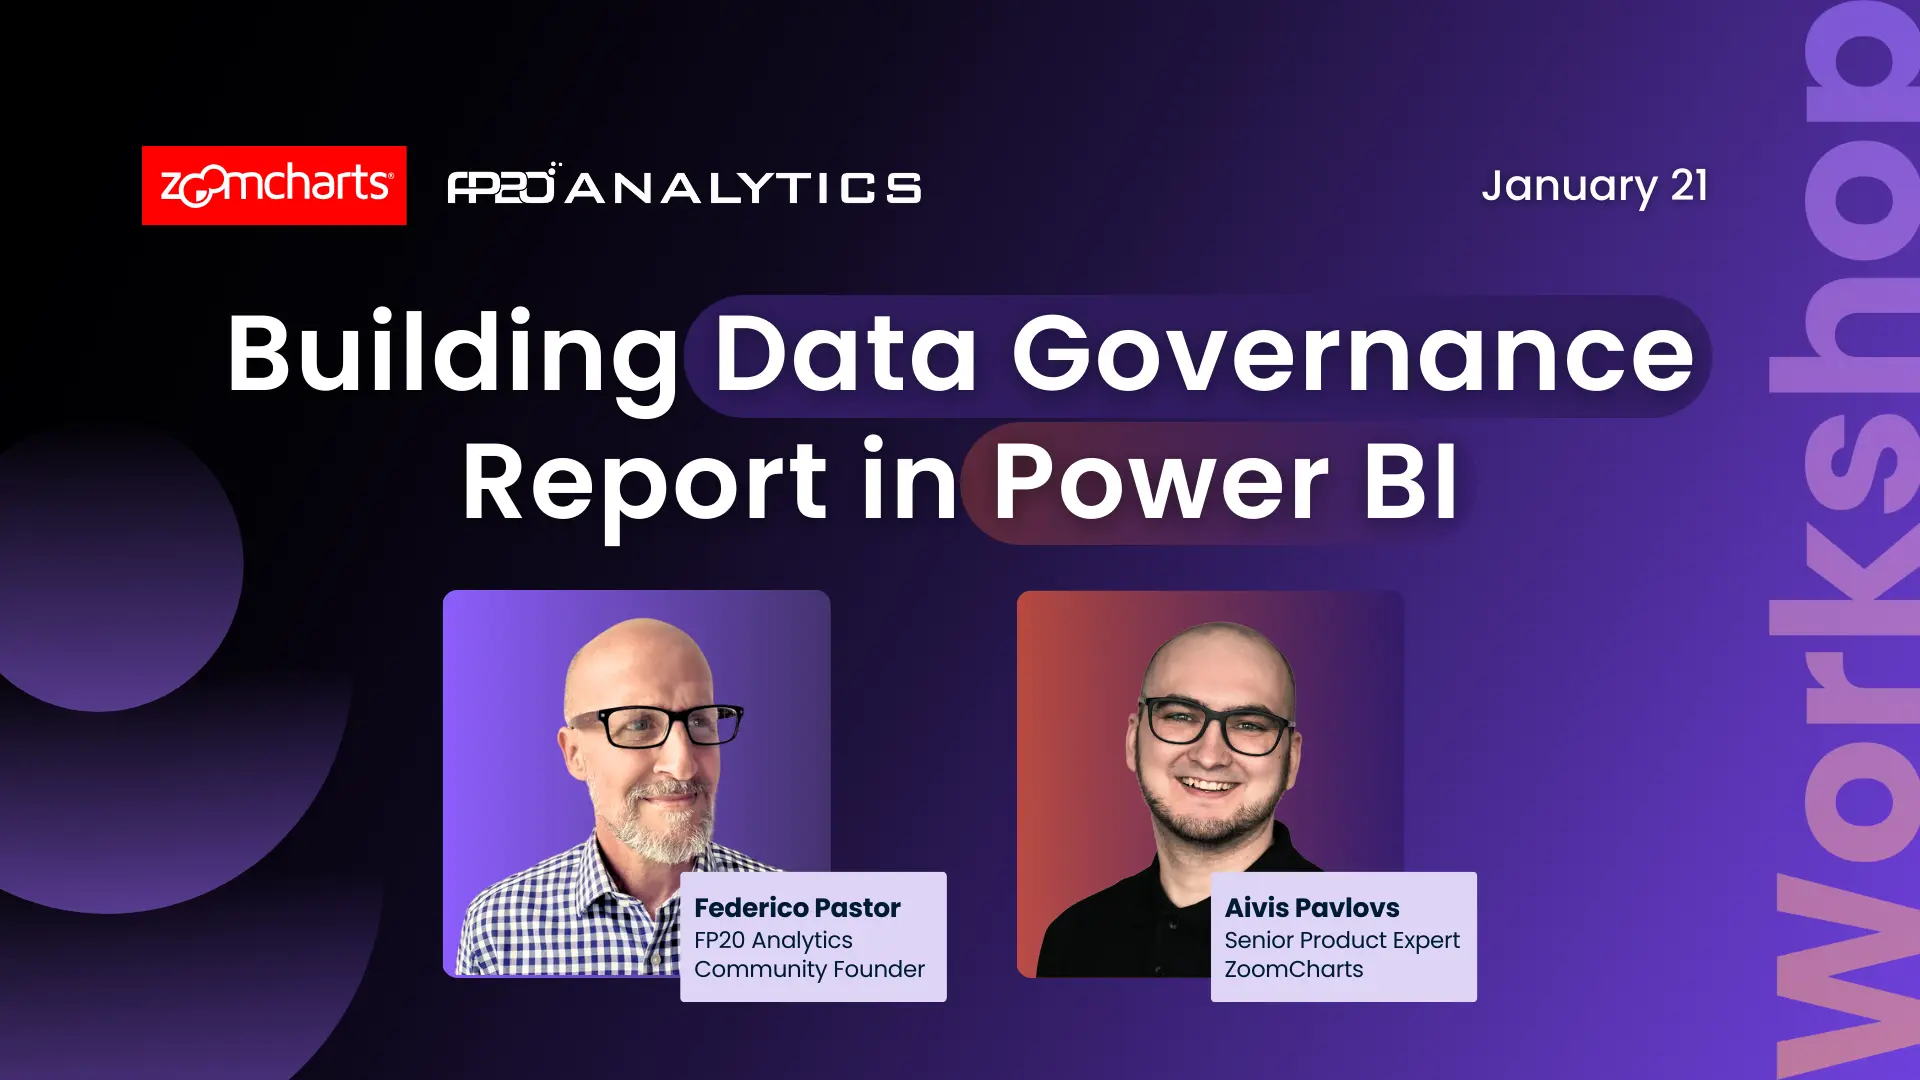
Workshop | Building Impactful Data Governance Reports in Power BI - LIVE Workshop
Workshop | Building Impactful Data Governance Reports in Power BI - LIVE Workshop
21 January | 08:00
-
Webinar | Let’s Explore the Best Power BI Reports for Data Governance LIVE
Webinar | Let’s Explore the Best Power BI Reports for Data Governance LIVE
11 February | 08:00
12 January - 04 February
Want to build professional Power BI reports and grow your portfolio?
This challenge helps you level up with expert feedback, hands-on workshops, webinars with MVPs, and visibility in our public results showcase. It’s a great way to learn, gain recognition, and connect with a supportive data community.
The challenge is hosted in partnership with FP20 Analytics - a LinkedIn community that brings together 20k+ passionate data professionals and helps new analysts improve their craft. It’s a welcoming space where you can practice, learn, and share your work with others. Learn more about the FP20 Analytics challenge on their website.
Learn directly from experienced Power BI professionals. Enjoy practical workshops on report-building techniques and book a one-on-one mentoring session to receive tailored advice on your submission.
Every participant receives detailed, constructive feedback on their report. It’s a valuable opportunity to improve your skills with real insights from seasoned analysts.
All participants receive a ZoomCharts Developer License, giving you full access to the Drill Down PRO visuals library.
Each challenge participant with a validated report will receive 5 free downloads from the Power BI Report Gallery.
The winners will be announced during a special live webinar on February 11.
 Crystal Andrea Dsouza, Content Analyst at Goodly, Power BI Developer
Register using the form above on this page.
Download the dataset using the Get the Dataset button on the left side of the page.
Read the challenge brief in the The Brief section to understand the data and requirements.
Activate your free Drill Down Visuals Developer License for Power BI. (watch the setup video or follow the step-by-step instructions).
Add your ZoomCharts license to Power BI Desktop.
Add ZoomCharts visuals from the Power BI visuals library or Microsoft Marketplace.
Build your report using the challenge dataset.
Your report must include at least two ZoomCharts Drill Down Visuals on the same page.
Recommended report format:
Up to 3 pages (including any drill-through pages)
Canvas size: 16:9 (default) or 1920 × 1080 (Full HD)
Join the challenge workshop to learn how to use ZoomCharts visuals effectively.
If you need help, book a free 1-on-1 consultation with the ZoomCharts team.
Look at previous challenge submissions for ideas and inspiration.
Log in to your account on this page and upload your report in .pbix format for validation.
If your report does not meet all requirements:
You will receive an email explaining what needs to be fixed.
You can update your report and submit it again.
Validation timeline:
Your report will be reviewed within 1–2 business days.
Once validated, you will receive a Publish to Web link that you can use in your portfolio or share online.
You will also receive personalized feedback within 1–2 business days to help you improve your report before the deadline.
Note:
You may resubmit your entry as many times as needed before the challenge deadline.
To be eligible for prizes, complete these steps:
Post the final version of your report (PDF) on your LinkedIn profile.
Use this caption:
"I am participating in FP20 Analytics ZoomCharts Challenge 33"
Include a short summary of your key insights and the Publish to Web link (if you have one).
Use the hashtags #FP20Analytics and #builtwithzoomcharts and tag @Federico Pastor and @ZoomCharts.
Obligatory! Share your report also in the FP20 Analytics LinkedIn Community group.
Follow ZoomCharts on LinkedIn.
The ZoomCharts team reviews and analyzes the Top 5 challenge submissions during live webinar.
You will learn best practices, visualization tips, and new Power BI skills.
The winner of the best report receives a $300 Amazon gift card from ZoomCharts.
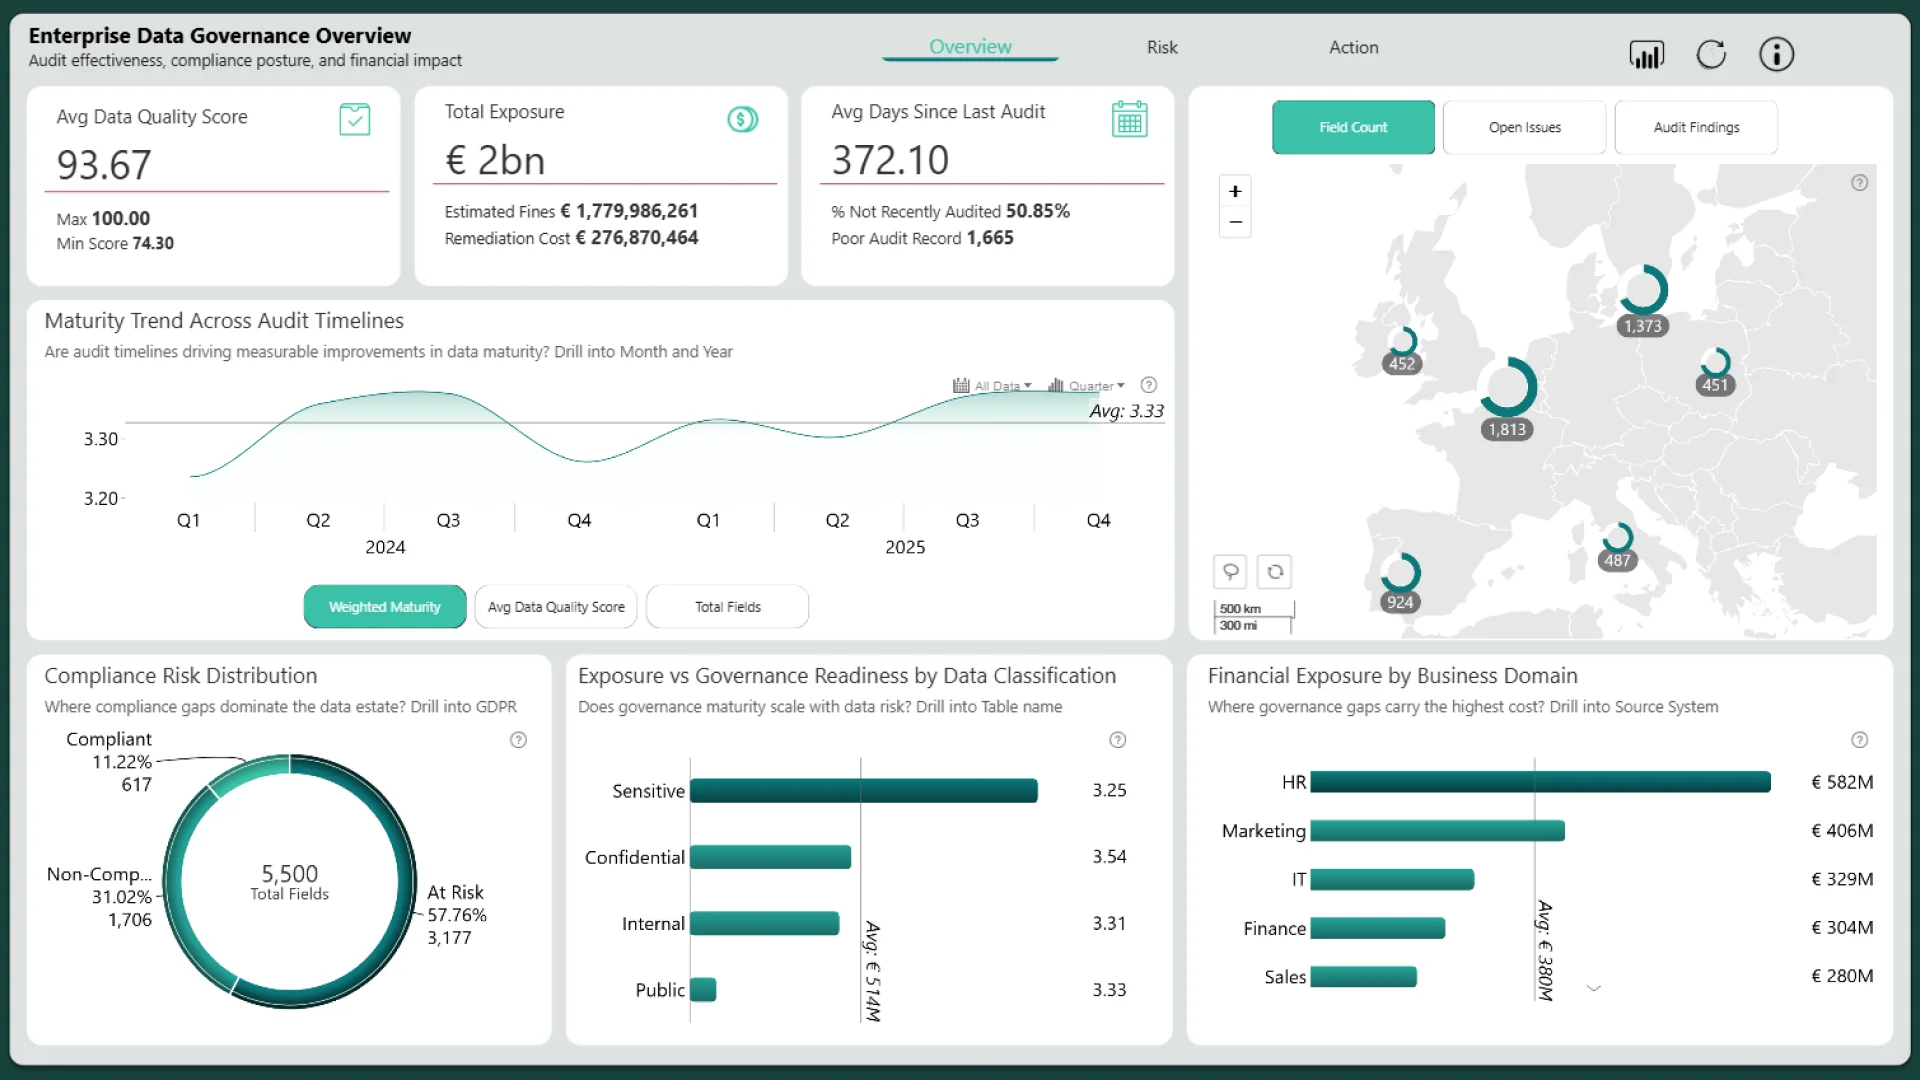
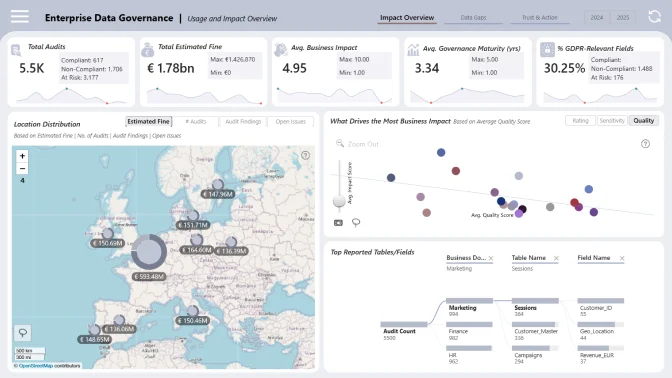
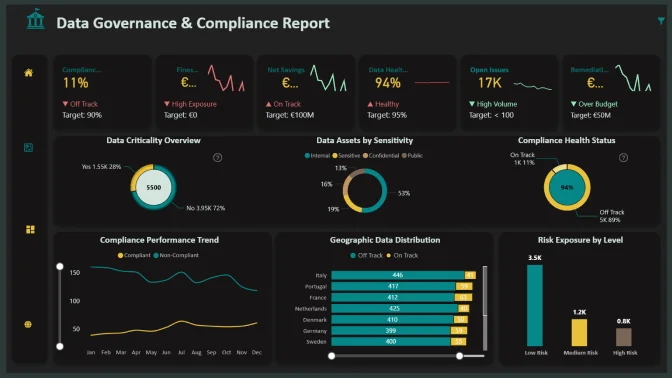
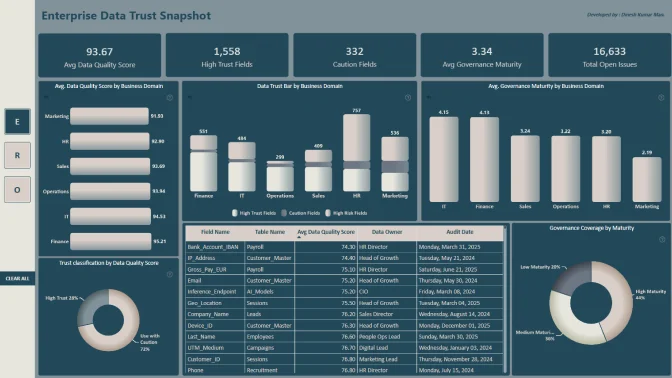
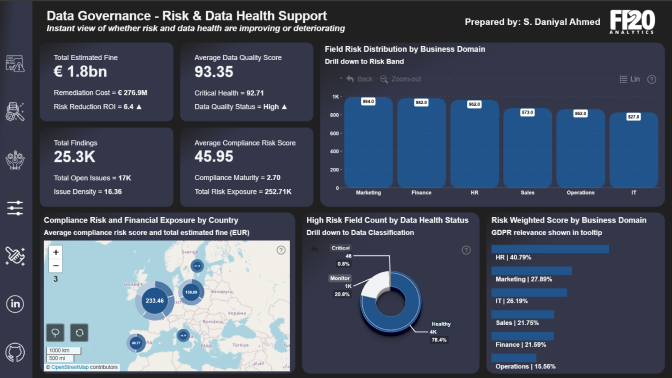
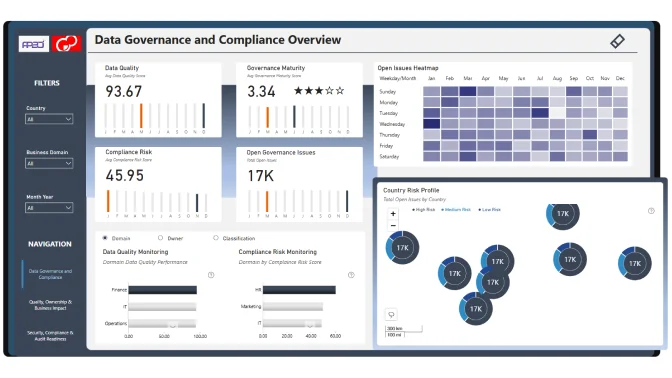
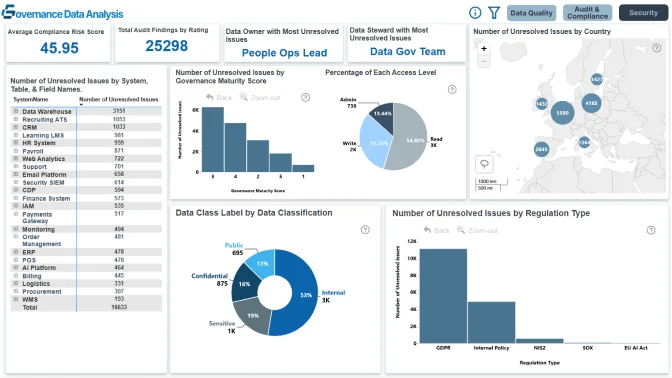
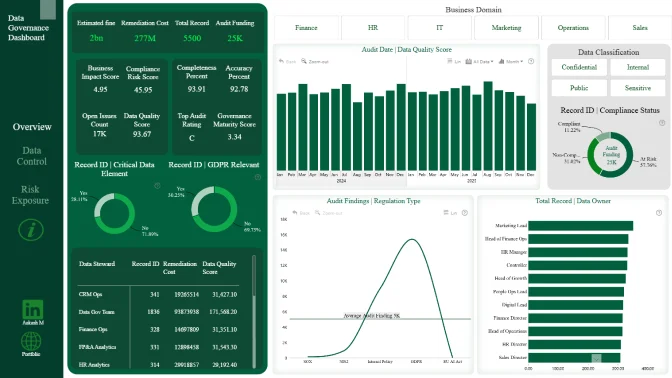
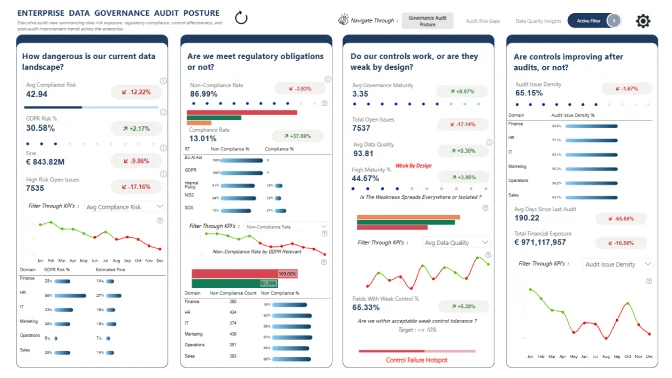
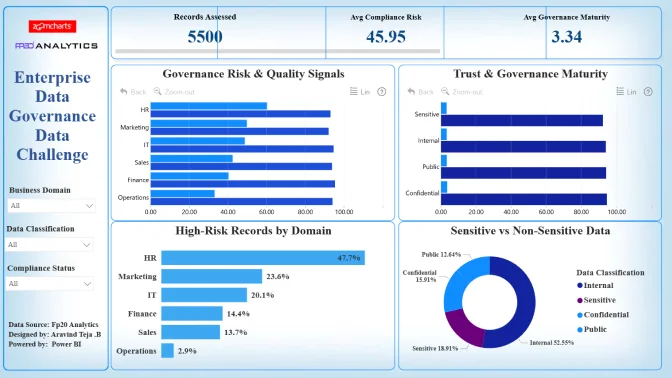
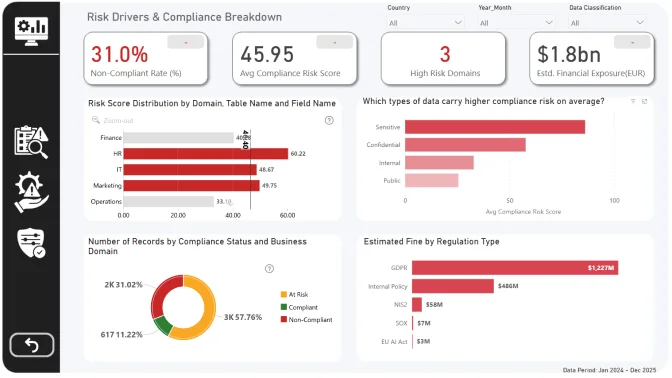
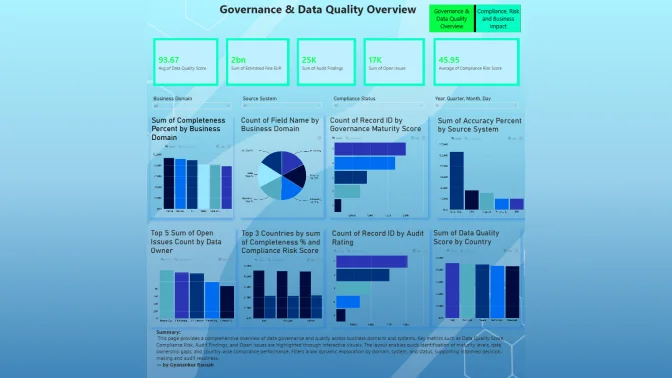
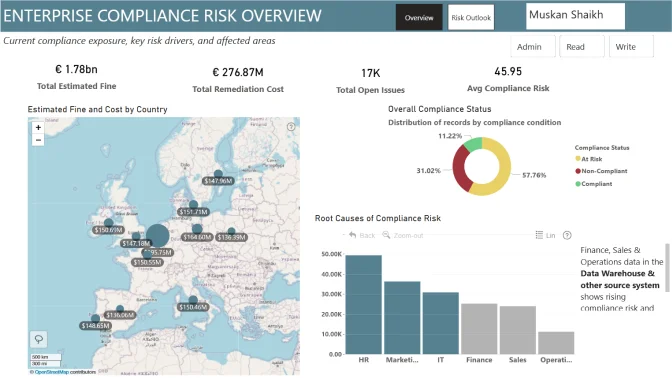
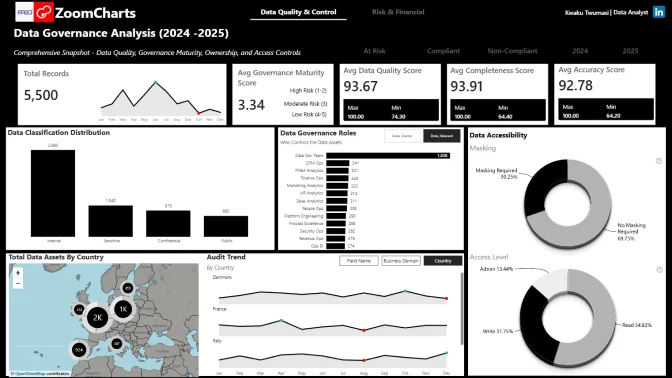
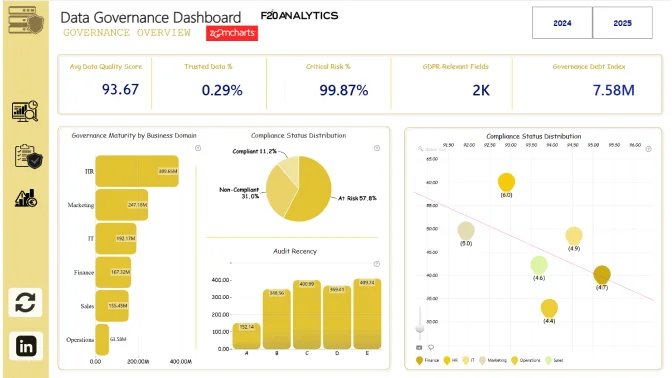
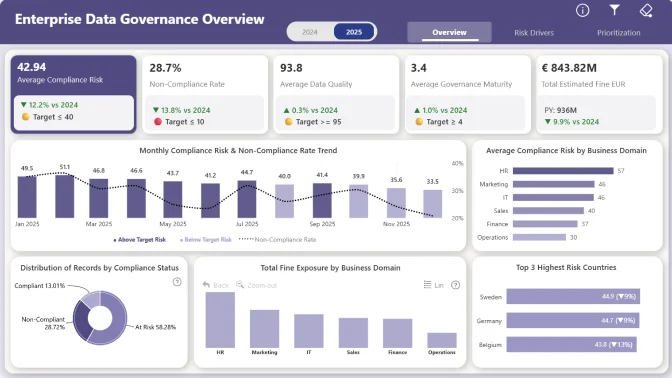
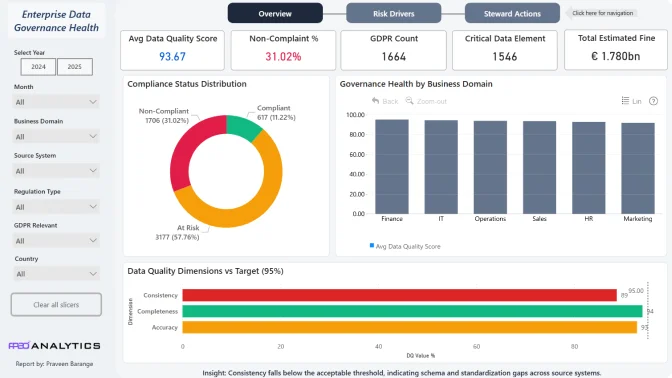
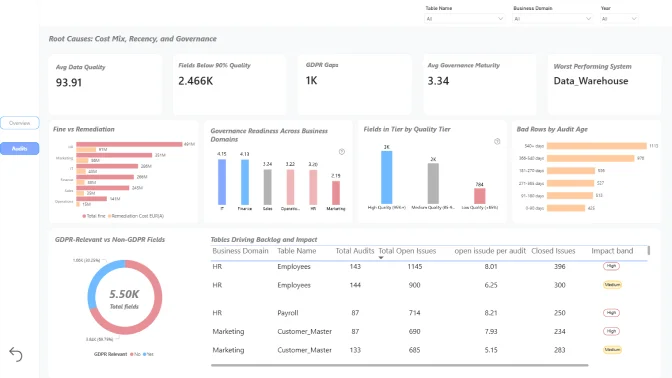
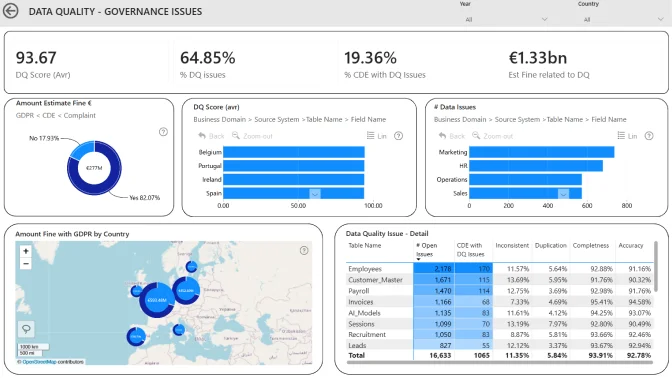
Enterprise Data Governance Data Analysis
In this challenge, you step into the role of a data governance analyst working within a large, multi-domain organization. The company manages data across Operations, Marketing, Finance, IT, and other business domains, with data flowing through numerous source systems, tables, and fields.
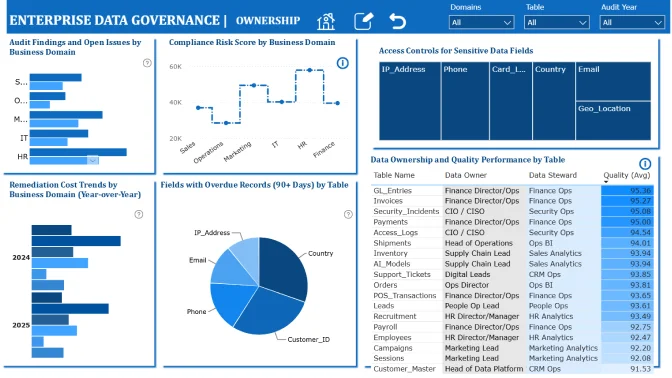
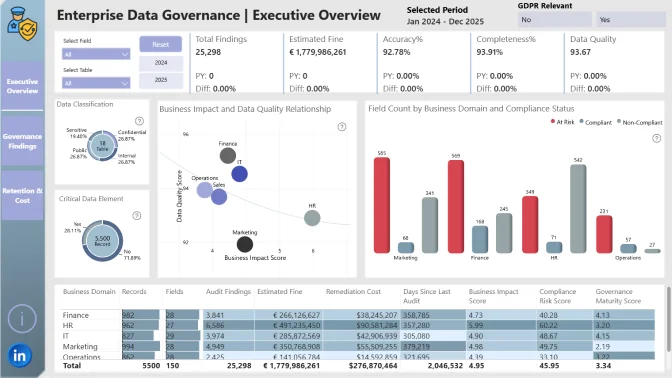
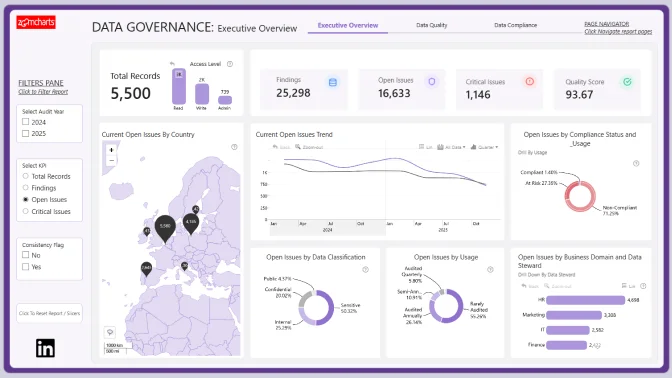
The dataset represents the organization’s data governance landscape, capturing information about data ownership, stewardship, classification, quality metrics, audit results, compliance risks, and potential financial exposure. Your goal is to improve data trust, enable safe and responsible data usage, strengthen data culture, and support scalable, confident decision-making across the organization.
As organizations become increasingly data-driven, strong data governance is critical for compliance, trust, and decision-making. This dataset allows you to assess how effectively data is managed across the enterprise.
By analyzing it, you will:
Evaluate data quality and governance maturity across business domains and systems.
Identify high-risk data assets, including GDPR-relevant and sensitive fields.
Understand how audit results, compliance status, and open issues impact business risk.
Highlight where poor governance could lead to financial penalties or remediation costs.
Your insights should help leadership prioritize governance improvements and reduce regulatory exposure.
Use Power BI and ZoomCharts visuals to:
Build a clear data model connecting governance, quality, audit, and risk metrics.
Create KPIs for data quality, compliance risk, and governance maturity.
Design an executive-ready Power BI report that tells a clear governance story.
✨ Note: These questions are only starting points. You are encouraged to explore the dataset creatively and surface insights that reveal how governance, compliance, and data quality influence business risk and decision-making across the organization.
Business users use reports to make data-driven decisions. That’s why reports are called effective if they enable users to drill down and filter data quickly and intuitively to find answers to any question they might have, and analyse data in all possible directions and dimensions.
Each report is evaluated based on three main criteria: intuitiveness, insightfulness, and interactivity. These factors ensure that the reports are not only accurate and functional, but also meet the target audience's needs and are ready to be presented to the end-users.
Workshop | Building Impactful Data Governance Reports in Power BI - LIVE Workshop
Workshop | Building Impactful Data Governance Reports in Power BI - LIVE Workshop
21 January | 08:00
-
Webinar | Let’s Explore the Best Power BI Reports for Data Governance LIVE
Webinar | Let’s Explore the Best Power BI Reports for Data Governance LIVE
11 February | 08:00
12 January - 04 February