Jun 06, 2024
Use Case: Network Analysis with Power BI and ZoomCharts
Here's how integrating Power BI with ZoomCharts revolutionized our client's social network analysis by offering dynamic, intuitive ways to explore data, improving efficiency, and providing actionable insights.
Here's how integrating Power BI with ZoomCharts revolutionized our client's social network analysis by offering dynamic, intuitive ways to explore data, improving efficiency, and providing actionable insights.
In today's fast-paced business world, having the right tools to turn data into useful insights is crucial. One of our clients discovered that integrating Power BI with ZoomCharts was a game-changer.
For safety reasons, we cannot disclose the client's name, and the reports showcased here are only similar to their actual reports. Here's how they made it happen and the success they achieved.
Why Power BI is Important
Power BI is essential for our clients’ ability to understand their performance and make informed decisions. By using Power BI in their workflow, they made it easier to analyze data and generate valuable insights with PRO Reports. Power BI’s user-friendly interface and powerful features have made it a key component in their business intelligence toolkit.
A Success Story: Network Analysis in Power BI
Our client recently used the Drill Down Graph PRO visual from ZoomCharts, which completely changed how they do social network analysis. This tool helped them understand the complex and changing relationships between people, places, incidents, and other entities. It allowed them to see connections they couldn't visualize before, making their analysis more intuitive and insightful with PRO Reports. This, in turn, was a massive help for crime investigation and prevention.
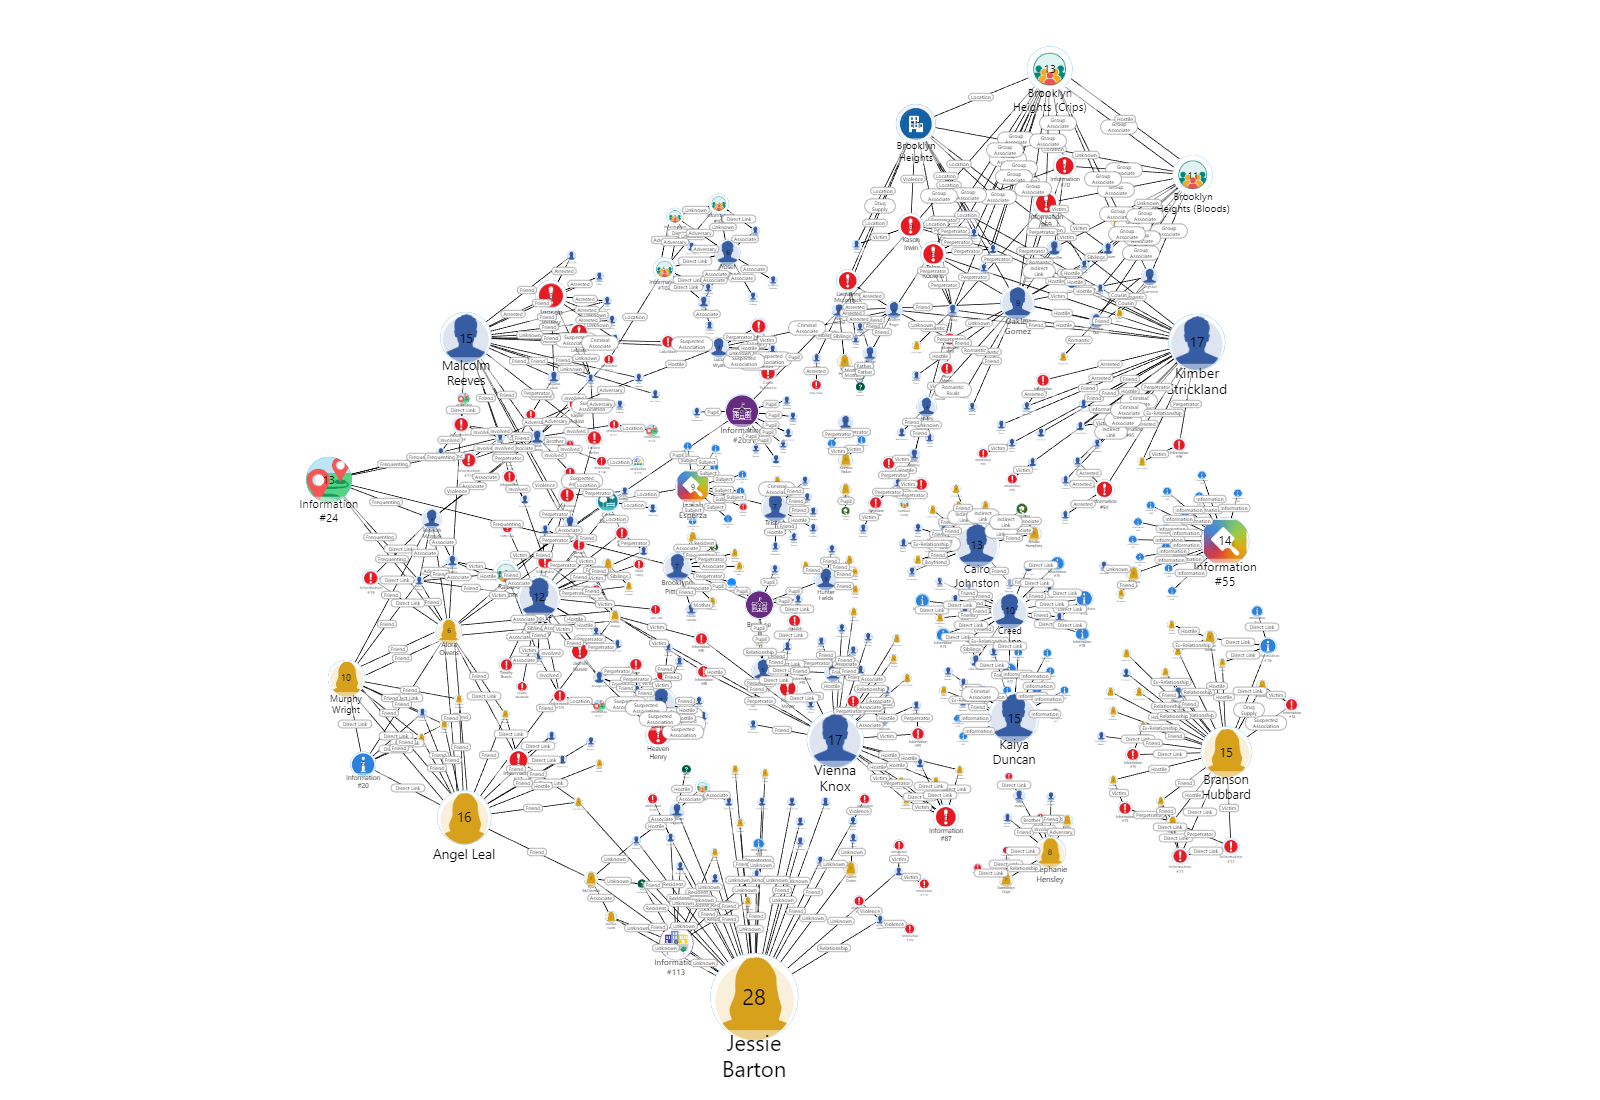
Social network analysis involves looking at how different people, places, and events are connected. This can be very complicated, especially when there are many different connections to consider. Before using ZoomCharts, our client found it hard to keep track of all these relationships. The Drill Down Graph PRO visual changed this by providing a clear and dynamic way to see all the connections.
Creating PRO Reports
The client’s main focus has been on social network analysis. With ZoomCharts, they can now track how individuals are connected to each other and to specific locations. The tool’s flexibility lets them visualize many entities in different ways, providing insights that were previously impossible to achieve. Using PRO Reports, they can quickly explore data and create comprehensive reports.
These reports are very helpful for making decisions because they present complex information in an easy-to-understand way. The ability to create PRO Reports quickly and efficiently has been a major advantage for our client.
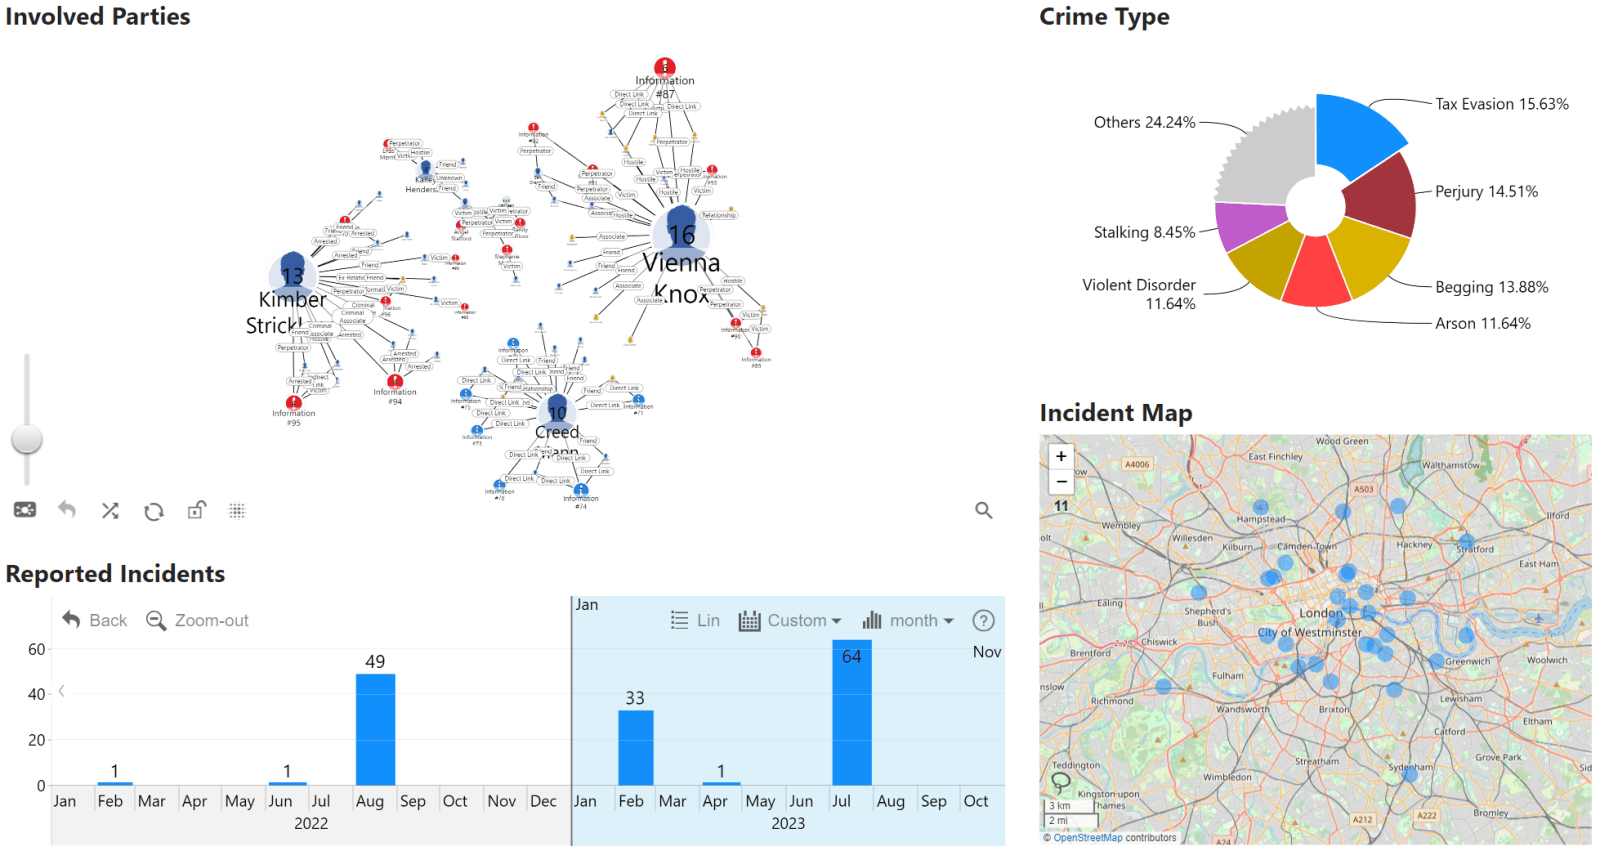
Power BI Network Analysis Report Example
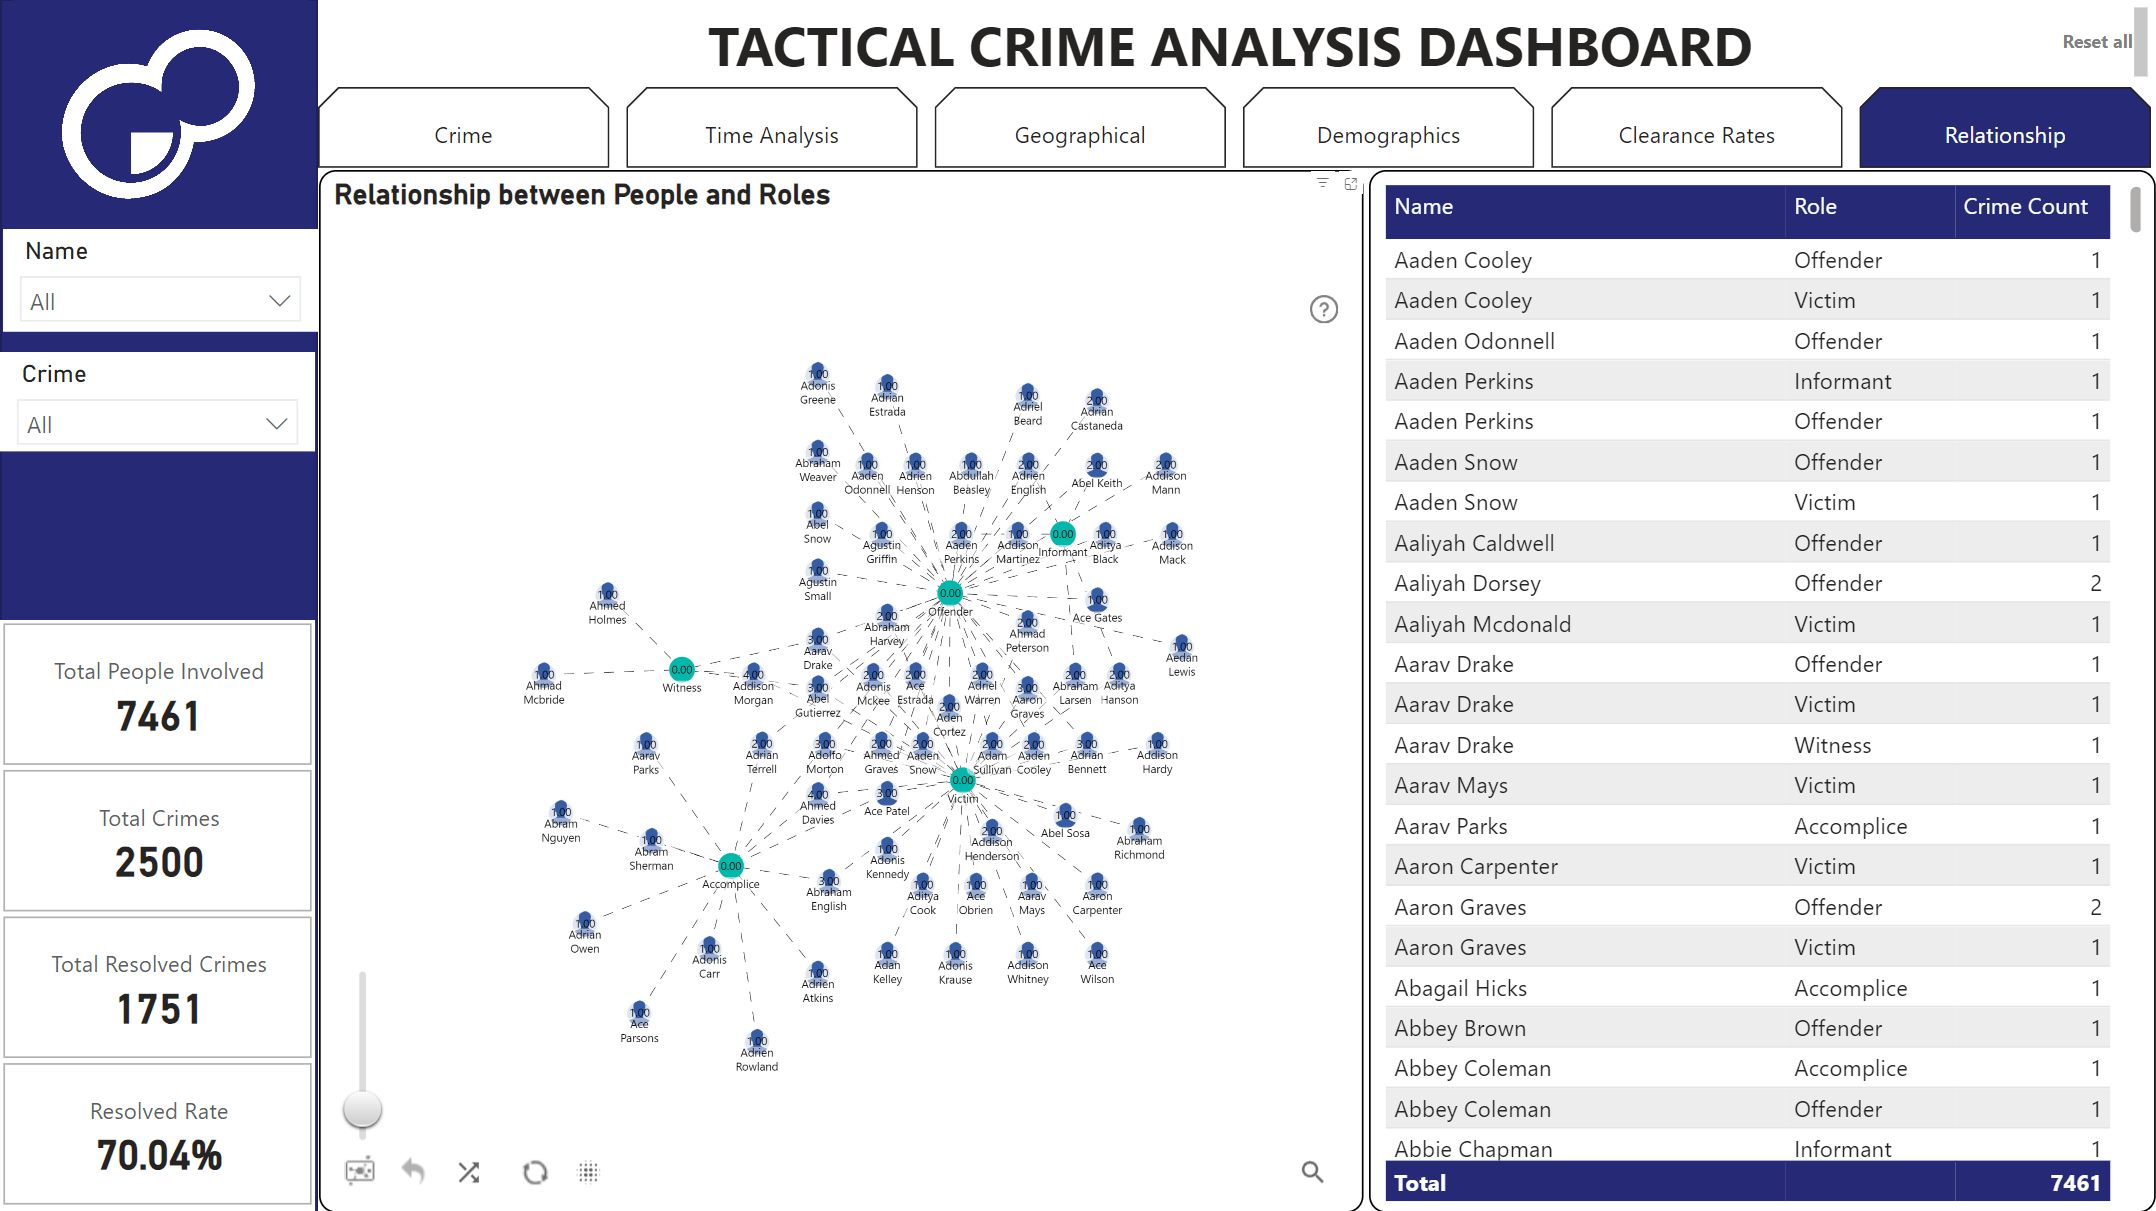
This report example is the winner of FP20 Analytics + ZoomCharts Tactical Crime Analysis challenge. All names or other data in the sample dataset are simulated.
Why Did They Choose ZoomCharts?
Here are the key reasons our client chose ZoomCharts:
- Flexibility: They can analyze multiple dimensions at once and view data at different levels. This means they can look at the big picture or zoom in on specific details as needed.
- Intuitive Use: It simplifies complex relationships, making it easy for new users to understand. Even people who are not experts in data analysis can use ZoomCharts to gain valuable insights.
- Dynamic Functionality: The tool moves smoothly from high-level views to detailed information. This dynamic functionality allows users to explore the data in a way that makes sense for their specific needs.
- Efficiency: It’s faster and easier to find answers when needed, allowing for immediate analysis during meetings. This saves time and makes meetings more productive.
Solving Previous Challenges
Before using ZoomCharts, the client faced significant challenges in visualizing complex information. They relied on static drawings to represent their data, which was a time-consuming and inefficient process. Typically, they spent 2-3 hours gathering and documenting information and another 2-3 hours creating visualizations using tools like MS Visio. These static drawings needed frequent updates, which required additional time and effort, often leading to outdated or multiple versions of the same data.
The process was cumbersome and did not allow for real-time data interaction. During meetings, any changes or updates to the data had to be manually incorporated later, causing delays, and reducing the efficiency of decision-making processes. Furthermore, static drawings could not capture the dynamic nature of their social network analysis, leading to incomplete or outdated representations of their data.

With ZoomCharts, all these issues were resolved. The intuitive use of ZoomCharts PRO Reports allowed them to dynamically interact with their data in real-time. They could make updates and analyze information live during meetings, eliminating the need for multiple static versions.
This not only saved time, but also ensured that their data was always up-to-date and accurate. The quick exploration capabilities of ZoomCharts provided deeper insights and more effective visualizations, making their analysis more insightful and actionable, especially with the powerful features of PRO Reports.
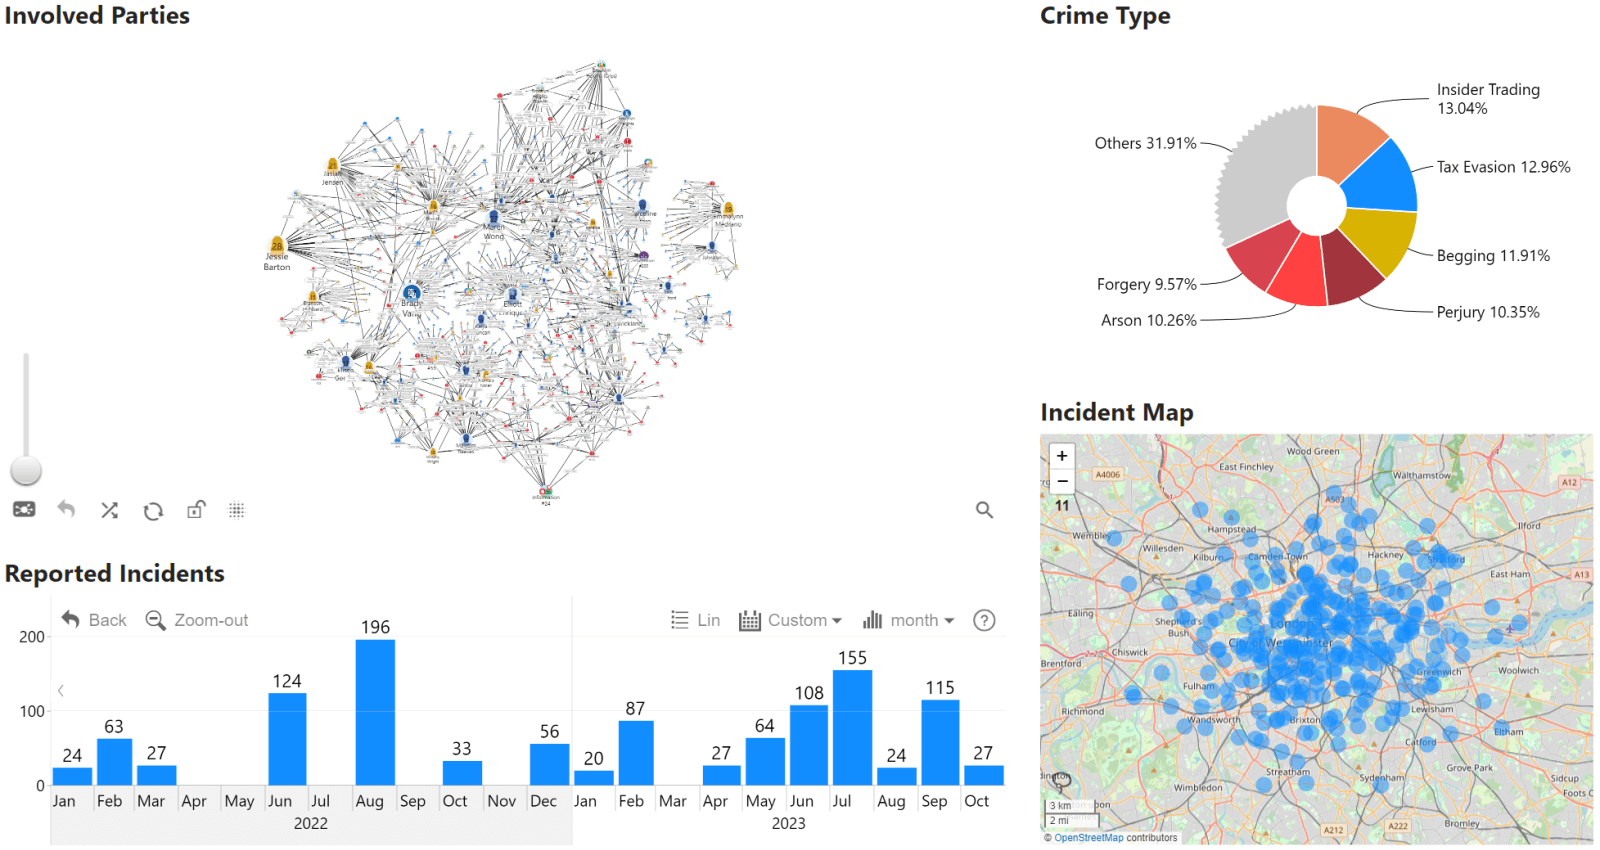
This example shows an overview of all reported incidents in a specific time period. If the user wants to explore deeper, they can simply click on the visuals to drill down, and the visuals will dynamically cross-filter the entire report. Here’s what happens when we select only 2023 as the time period on the timeseries chart and select only one crime type on the donut chart – the graph instantly filters only data related to these incidents.
Strategic and Operational Benefits
Since adopting ZoomCharts and starting to use PRO Reports for their day-to-day data tasks, the client has improved their efficiency and an increased usage rate of their reports.
Improved Response Times
One of the biggest advantages of using ZoomCharts is the improvement in response times. Our client can quickly access and analyze data, allowing them to make decisions on the spot. This is especially important in situations where timely decisions are critical. By using ZoomCharts, they have reduced the time it takes to go from data collection to decision-making, leading to more efficient operations.
Financial Benefits
The financial benefits of using ZoomCharts are also significant. By reducing the time and resources needed for data visualization, our client has been able to save money. The efficiency of ZoomCharts means that fewer people are needed to create and update reports, freeing up resources for other important tasks.
A Strong Recommendation
Our client highly recommends ZoomCharts to other companies. Its affordability, integration with Power BI, and transformative impact make it a valuable tool for any organization looking to improve their data analysis capabilities. The client has found that ZoomCharts not only meets but exceeds their expectations, providing them with the tools they need to succeed.
Future Possibilities
Looking ahead, our client is excited about the future possibilities with ZoomCharts. They are continually finding new ways to use them to gain more insights and improve their operations. As they continue to explore the capabilities of ZoomCharts, they expect to uncover even more benefits and efficiencies. The client is confident that ZoomCharts will remain a key part of their business intelligence strategy for years to come.
Conclusion
Integrating Power BI with ZoomCharts has revolutionized how our client handles social network analysis. The flexibility, dynamic functionality, and intuitive use have provided them with the tools they need to make quick and efficient decisions. They are excited about the future possibilities and benefits they will continue to discover.
For any business looking to enhance their data visualization and analysis, ZoomCharts in Power BI is an unbeatable solution. The intuitive use of the PRO Reports features allows for quick exploration and generates insightful, comprehensive reports, driving success and efficiency in data-driven decision-making. Whether you are looking to improve your social network analysis or any other aspect of your business intelligence, ZoomCharts is the tool that can help you achieve your goals.

Want more info like this?
Subscribe to our newsletter and be the first to read our latest articles and expert data visualization tips!


