Purchasing and managing a Drill Down Visuals license through AppSource
Purchasing ZoomCharts visuals on AppSource
We’ve simplified the process of purchasing ZoomCharts visuals. You can now do that via Microsoft AppSource, which is a convenient and easy-to-use repository for all your custom visuals.
Step 1: Find Drill Down Visuals on AppSource
In the pricing page, select Basic plan and then select your desired Drill Down Visuals custom visualization, you will be redirected to AppSource.
On AppSource, press Buy now to proceed to the purchase page.
Important note: Only the person who purchased the licenses and is an administrator for the tenant can assign a license in Microsoft 365 Admin center. Ensure you have an admin role if you are purchasing licenses for anyone other than yourself.
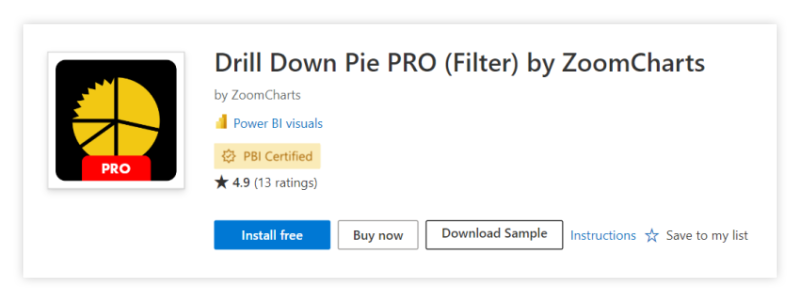
Step 2: Confirm price and billing options
Choose the plan, and once you’re on the checkout page, you can select between monthly and yearly billing periods. Furthermore, you can opt-in for automatic payments, and select the number of user licenses you want to purchase.
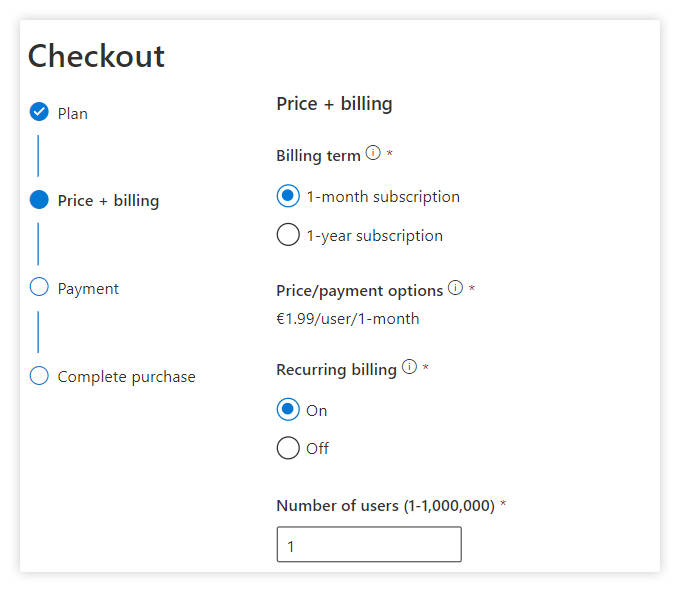
Step 3: Confirm price and billing options
This is the last step you need to take before you can purchase and start using ZoomCharts custom visuals. On this page, you’ll need to confirm your sold-to address, payment method and tax ID if applicable. If you don’t already have a payment method associated with your AppSource account, simply press Add a new payment method and enter your payment card details.
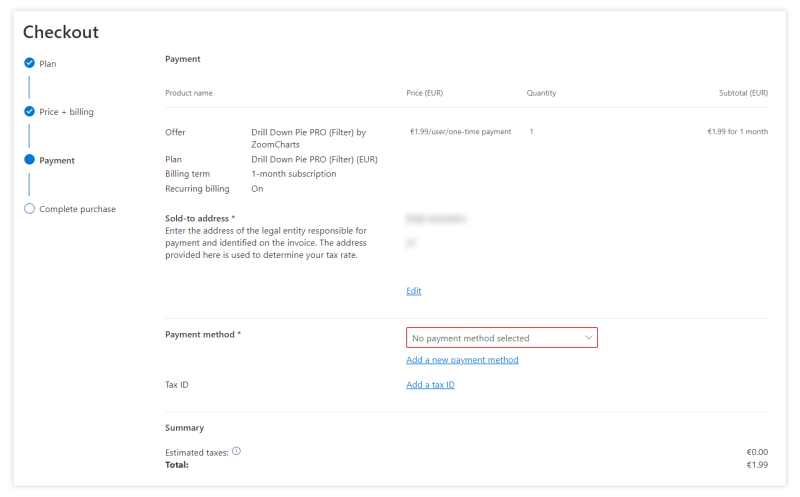
Afterwards, press Place Order and confirm the payment. You can then assign the licenses to your team members.
You will receive a license automatically within 24 h after purchasing the visual (Microsoft’s FAQ states 5 minutes, but we have noticed that in practice it can take up to 24 h).
Managing your ZoomCharts visual licenses in Microsoft 365 Admin Center
You can manage the licenses for custom visuals in the same place as your Microsoft products, including Office and Power BI - Microsoft 365 Admin Center.
Step 1: View all your owned products
In the Admin Center, open the Billing section in the sidebar and click on Your Products. You will be presented with an overview of all your product licenses. Click on the product that you want to manage.
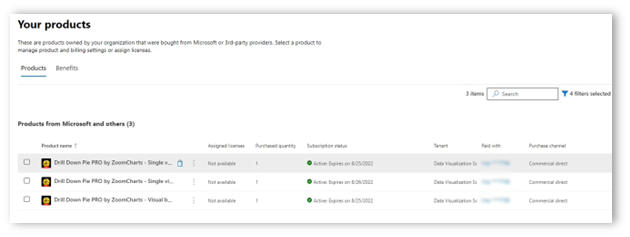
Step 2: Manage your payment settings
On this page, you can make changes to the billing settings and buy additional licenses for your team.
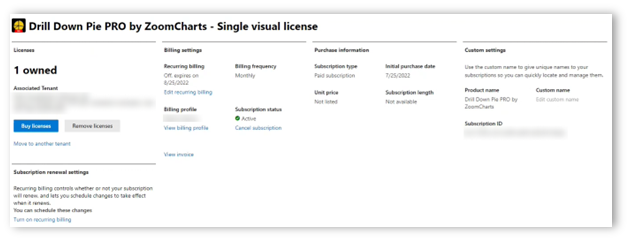
Step 3: View your licenses
You can get an overview of all your owned product licenses by heading to Billing -> Licenses. On this page, you can view how many licenses you own and how many of them are assigned to users. You can then click on the product you want to manage.
Step 4: Manage your licenses
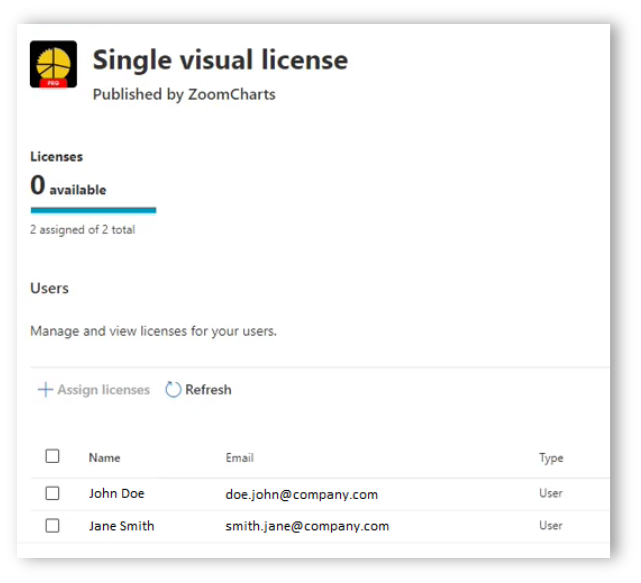
Once you’ve selected the product you want to manage, you will proceed to a page that shows all the users who have been assigned a license. If you want to assign a license to a new user, simply click on Assign licenses. The page will open a menu which will allow you to search for a specific employee or group to which you want to assign a license.
If you want to unassign licenses, select the checkboxes for all the users you want to remove licenses from, and click Unassign licenses. Keep in mind that any changes that you make may take up to an hour to process.
Adding ZoomCharts visuals to Power BI
Once the administrator has assigned a license to a user or group, users can add licensed Drill Down Visuals to the report and start using them. See the instruction here.
Step 1: Download the visual from AppSource
Press the Download button on the product page to download the .pbiviz file. Afterwards, open Power BI and press the ellipsis icon in the Visualizations panel. Press Import a visual from a file and locate the file you just downloaded. The visual’s icon will appear in the list of visualizations.
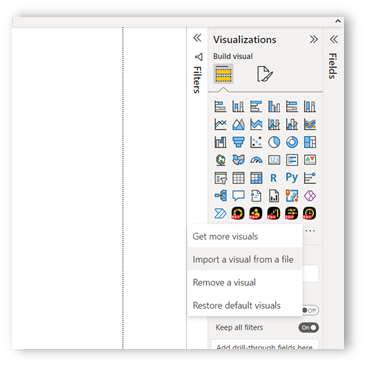
Alternatively, press Get more visuals if you want to browse AppSource within Power BI and download the visual directly. Enter the name of the visual into the search bar, open the product page and press Add to download it.
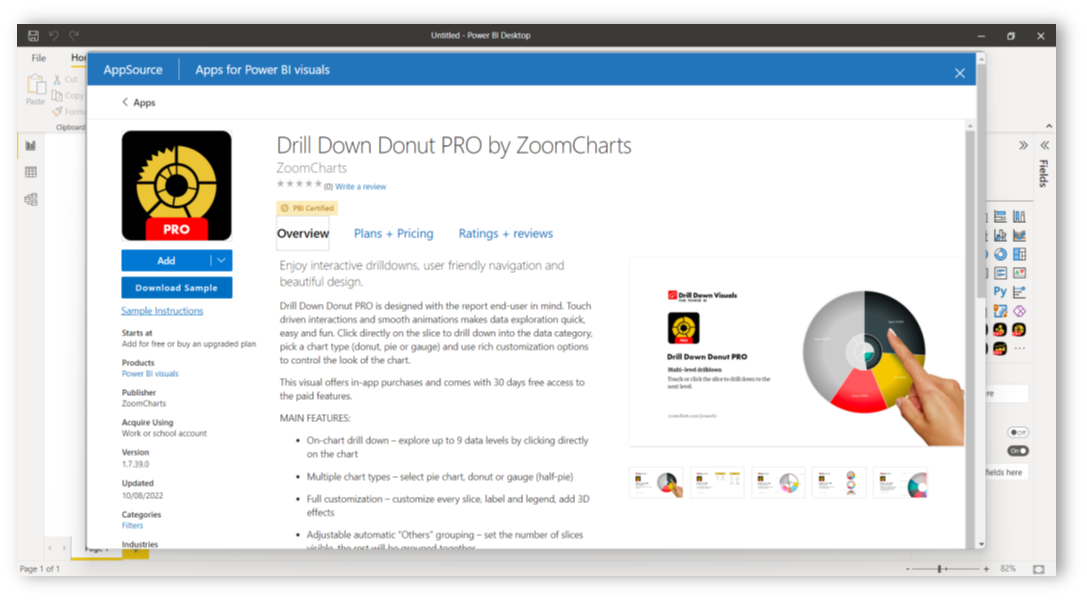
Step 2: Add the visual to your report
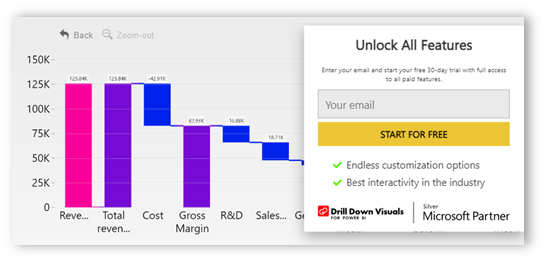
Click on the visual’s icon in the visualization panel, and it will appear on the report. Make sure that you have logged in with an account that has been assigned a license. If the user has been assigned a license, it will be verified by Power BI, and you can start using the PRO features of ZoomCharts visuals. If your account does not have a valid license, you will see a prompt to start a free 30-day trial.
Was this helpful? Thank you for your feedback!
Sorry about that.
How can we improve it?