Series
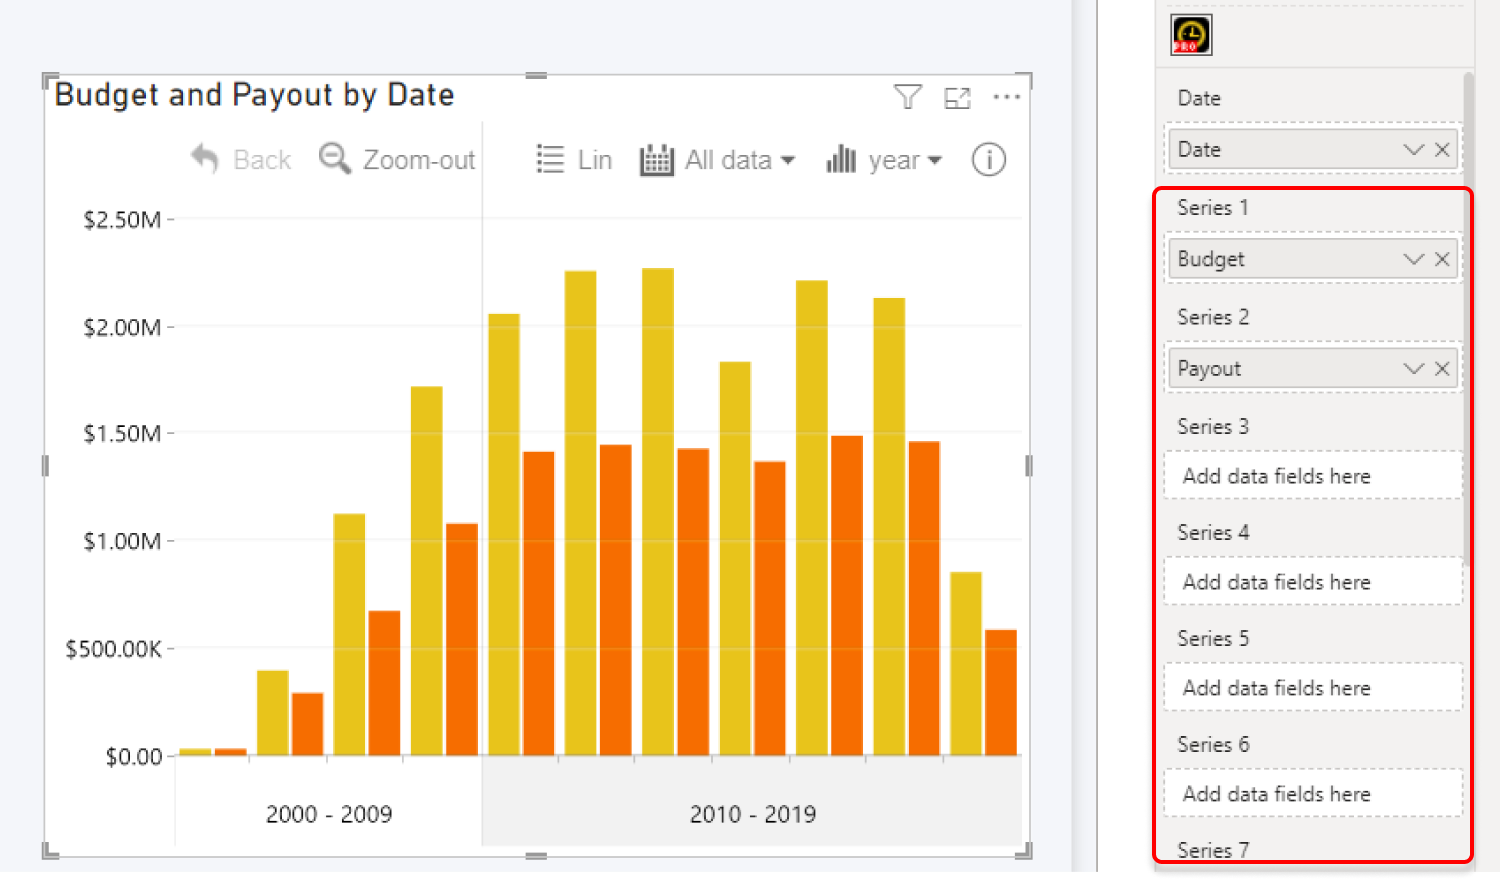
This field contains the values which will be visualized on the y-axis. Add each series in its own Series field (numbered 1 to 25), and they will be displayed as individual columns, lines, or areas. You can customize each series independently using their respective Series Configuration sections in the Format Visual tab.

Each series must contain only numerical values.
TimeSeries PRO has limited support for DAX measures, and the date hierarchy will default to the lowest level if DAX measures are applied to any series. If you require full support for DAX, we recommend using Drill Down Timeline PRO which uses matrix data structure.

Was this helpful? Thank you for your feedback!
Sorry about that.
How can we improve it?