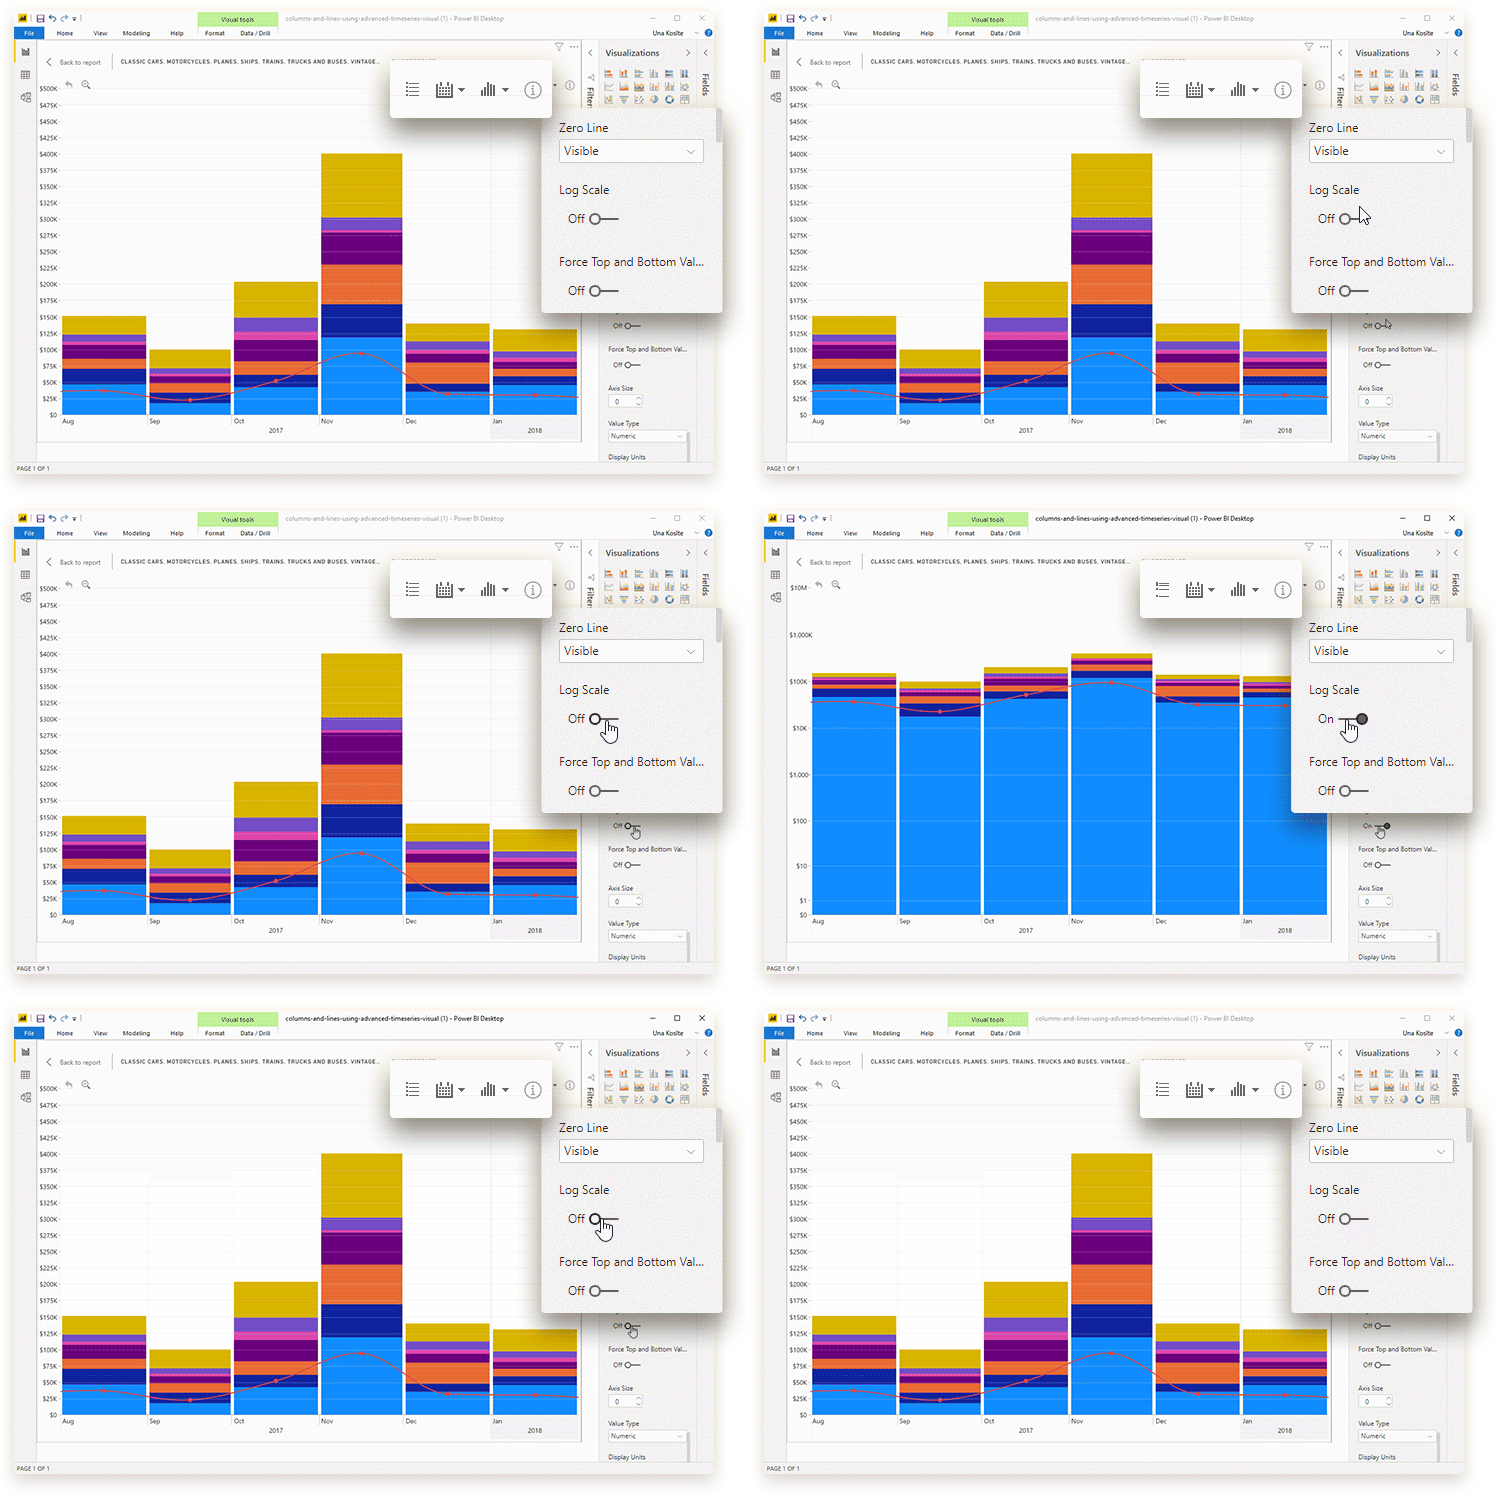
Log scale
If this toggle is set to On, the primary y-axis will
use a logarithmic scale to display values instead of a linear scale.
Logarithmic scale may be useful in certain scenarios where
there’s a large difference between minimum and maximum values on the same axis.
By default, this setting is disabled.

Was this helpful? Thank you for your feedback!
Sorry about that.
How can we improve it?