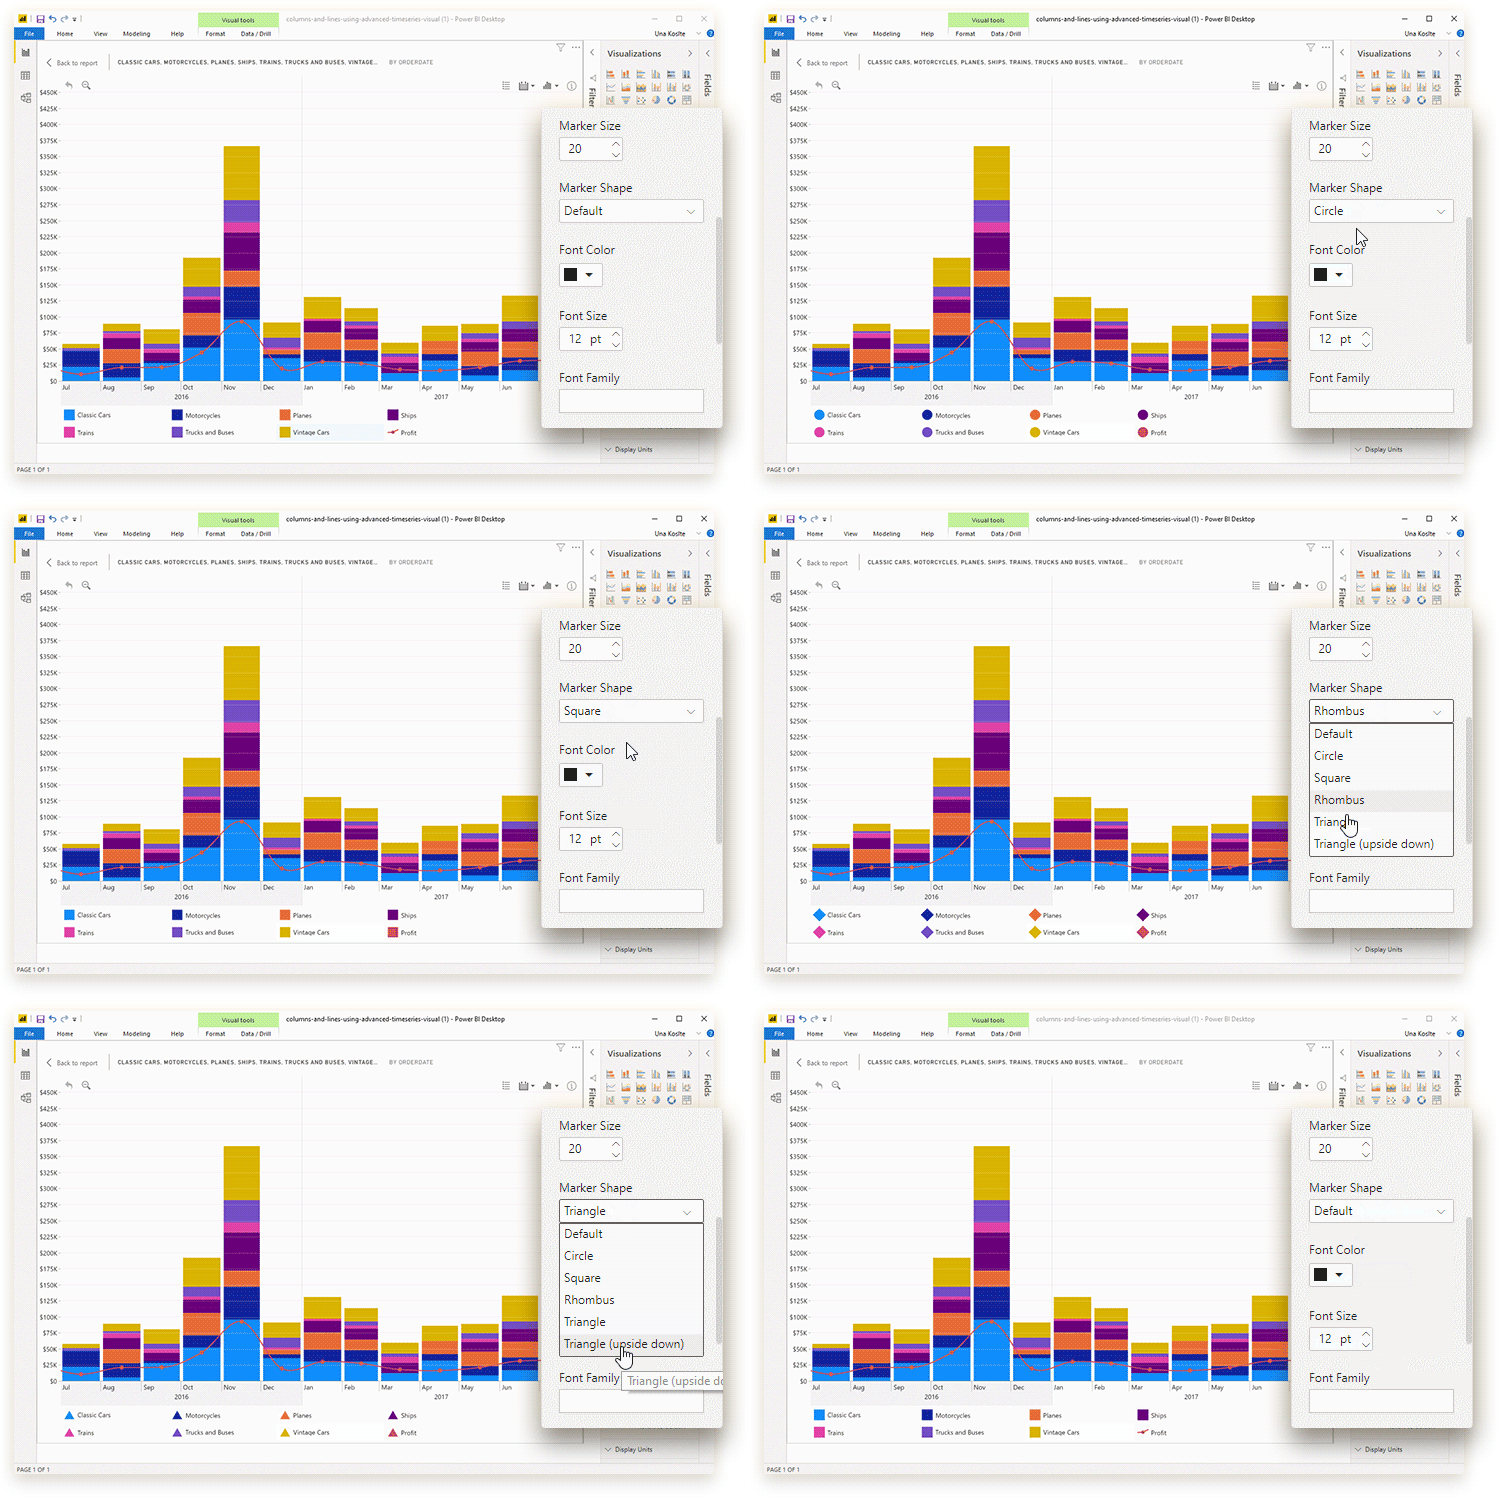
Marker shape
This property controls the shape of the legend markers.
The default behavior for the chart is to display legends that represent the chart type that has been selected for each series. For example, the image below shows that Payout is represented as an area, both in legend block and in the chart itself.
The default setting is “Default”, but it can be one of the following:
- Default (reflects the chart type)
- Circle
- Square
- Rhombus
- Triangle
- Triangle (upside down)

Was this helpful? Thank you for your feedback!
Sorry about that.
How can we improve it?