Interactivity
Move the Chart
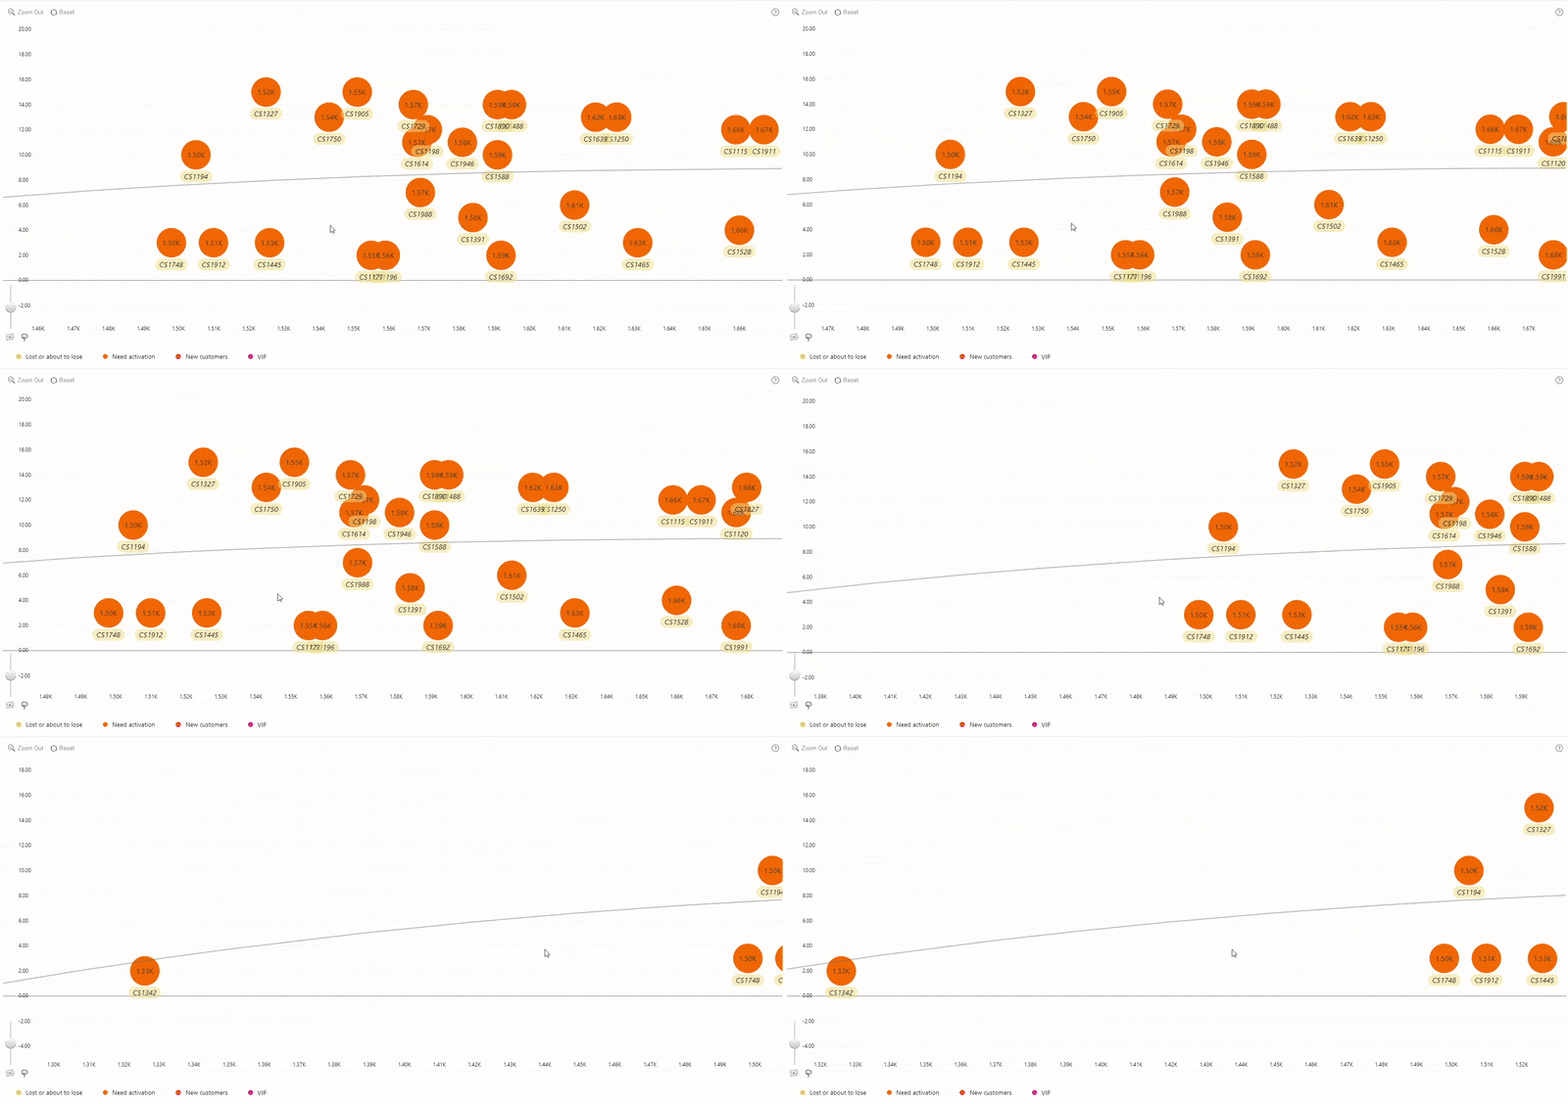
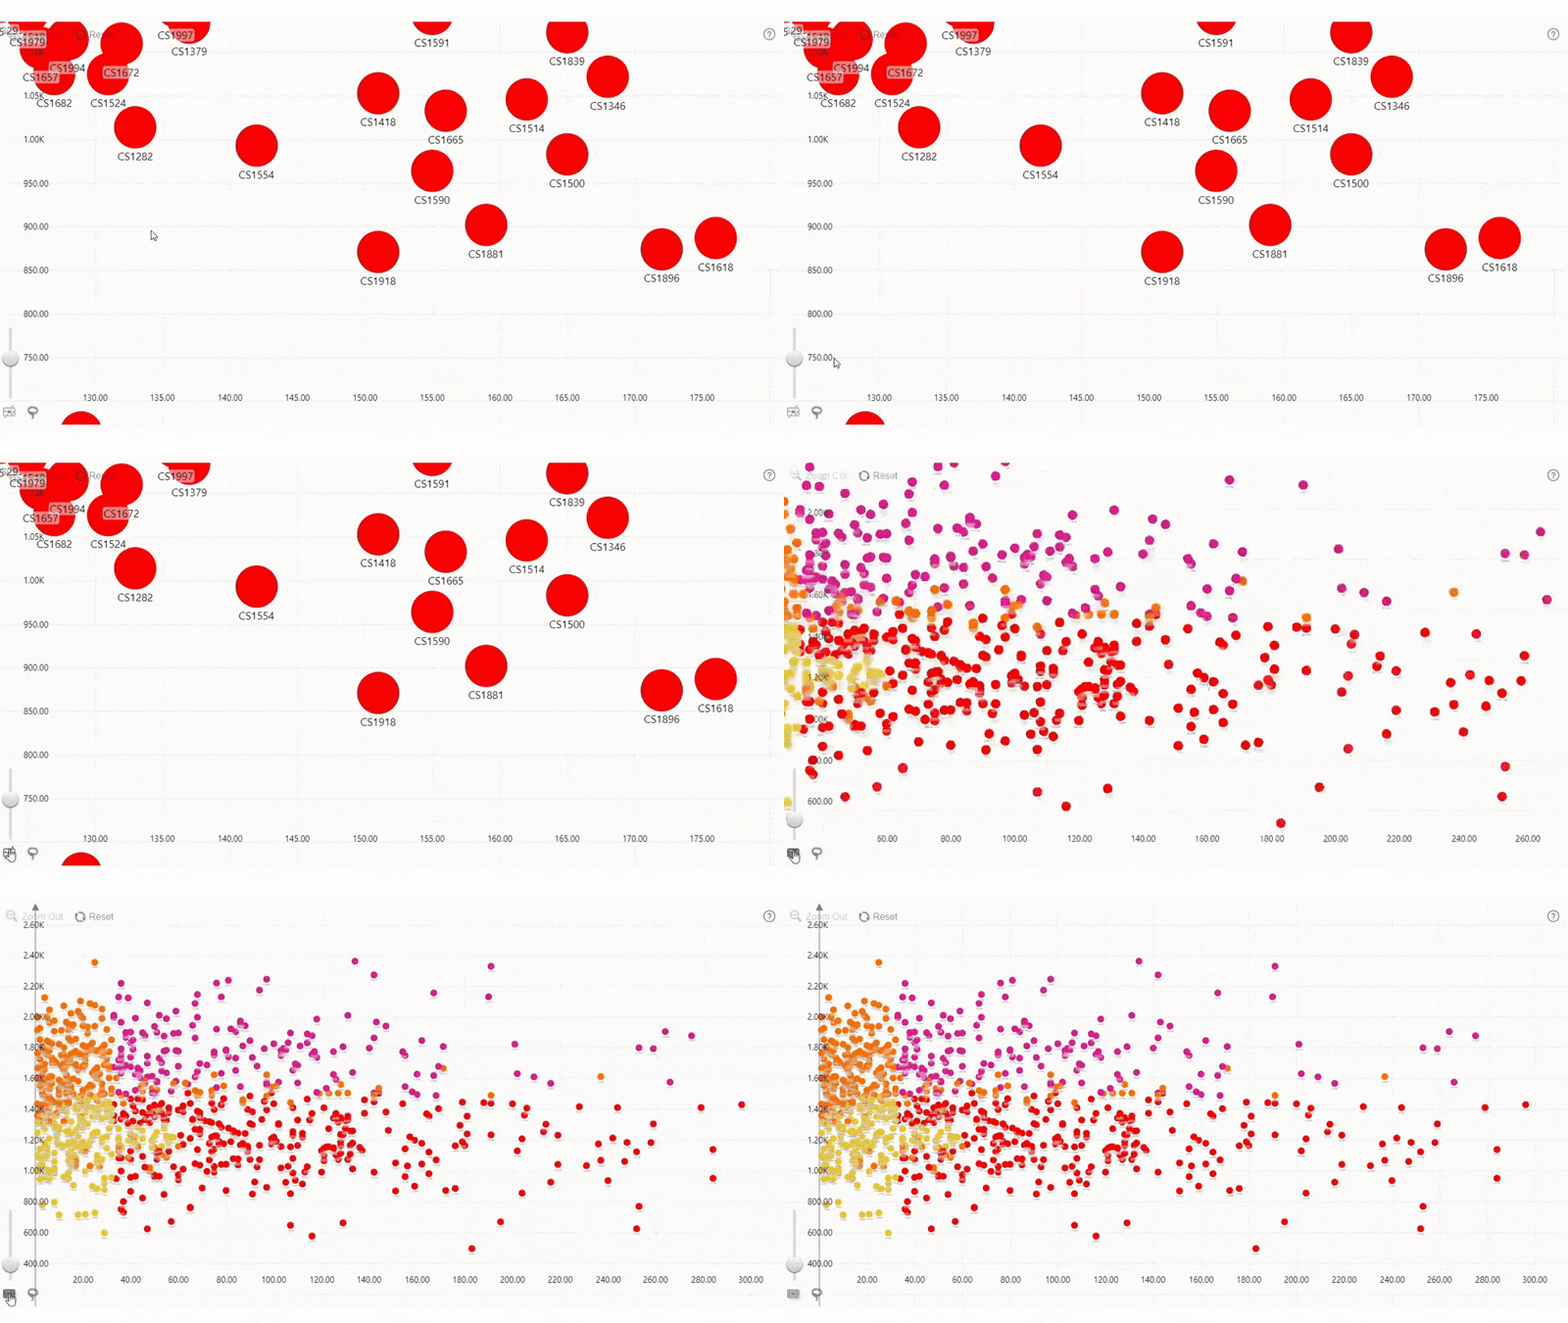
You can freely pan the scatter chart in any direction by holding the left mouse button while dragging your mouse. For touch devices, this can be done with tap and hold.
Drill Down
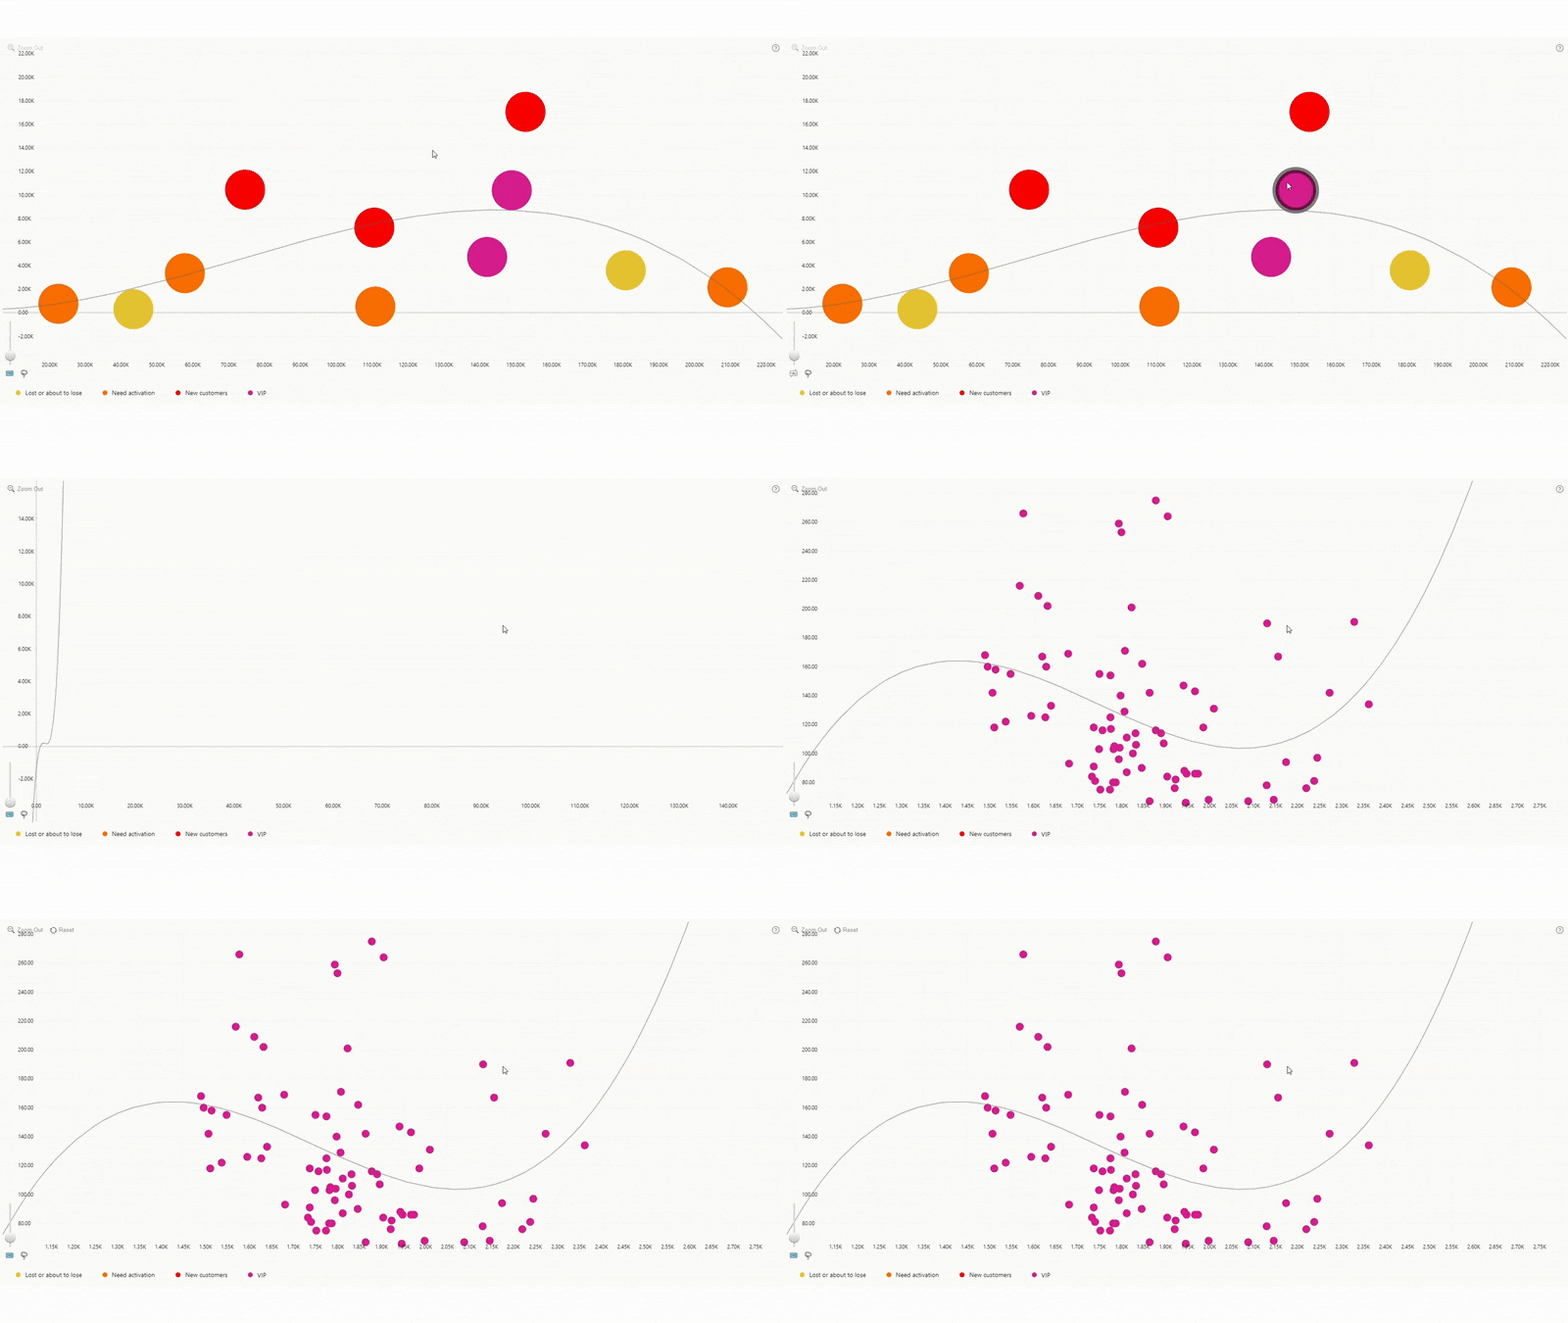
To drill down to a category and reveal the next level of hierarchy, left-click or tap on a data point marker.
Drill Up
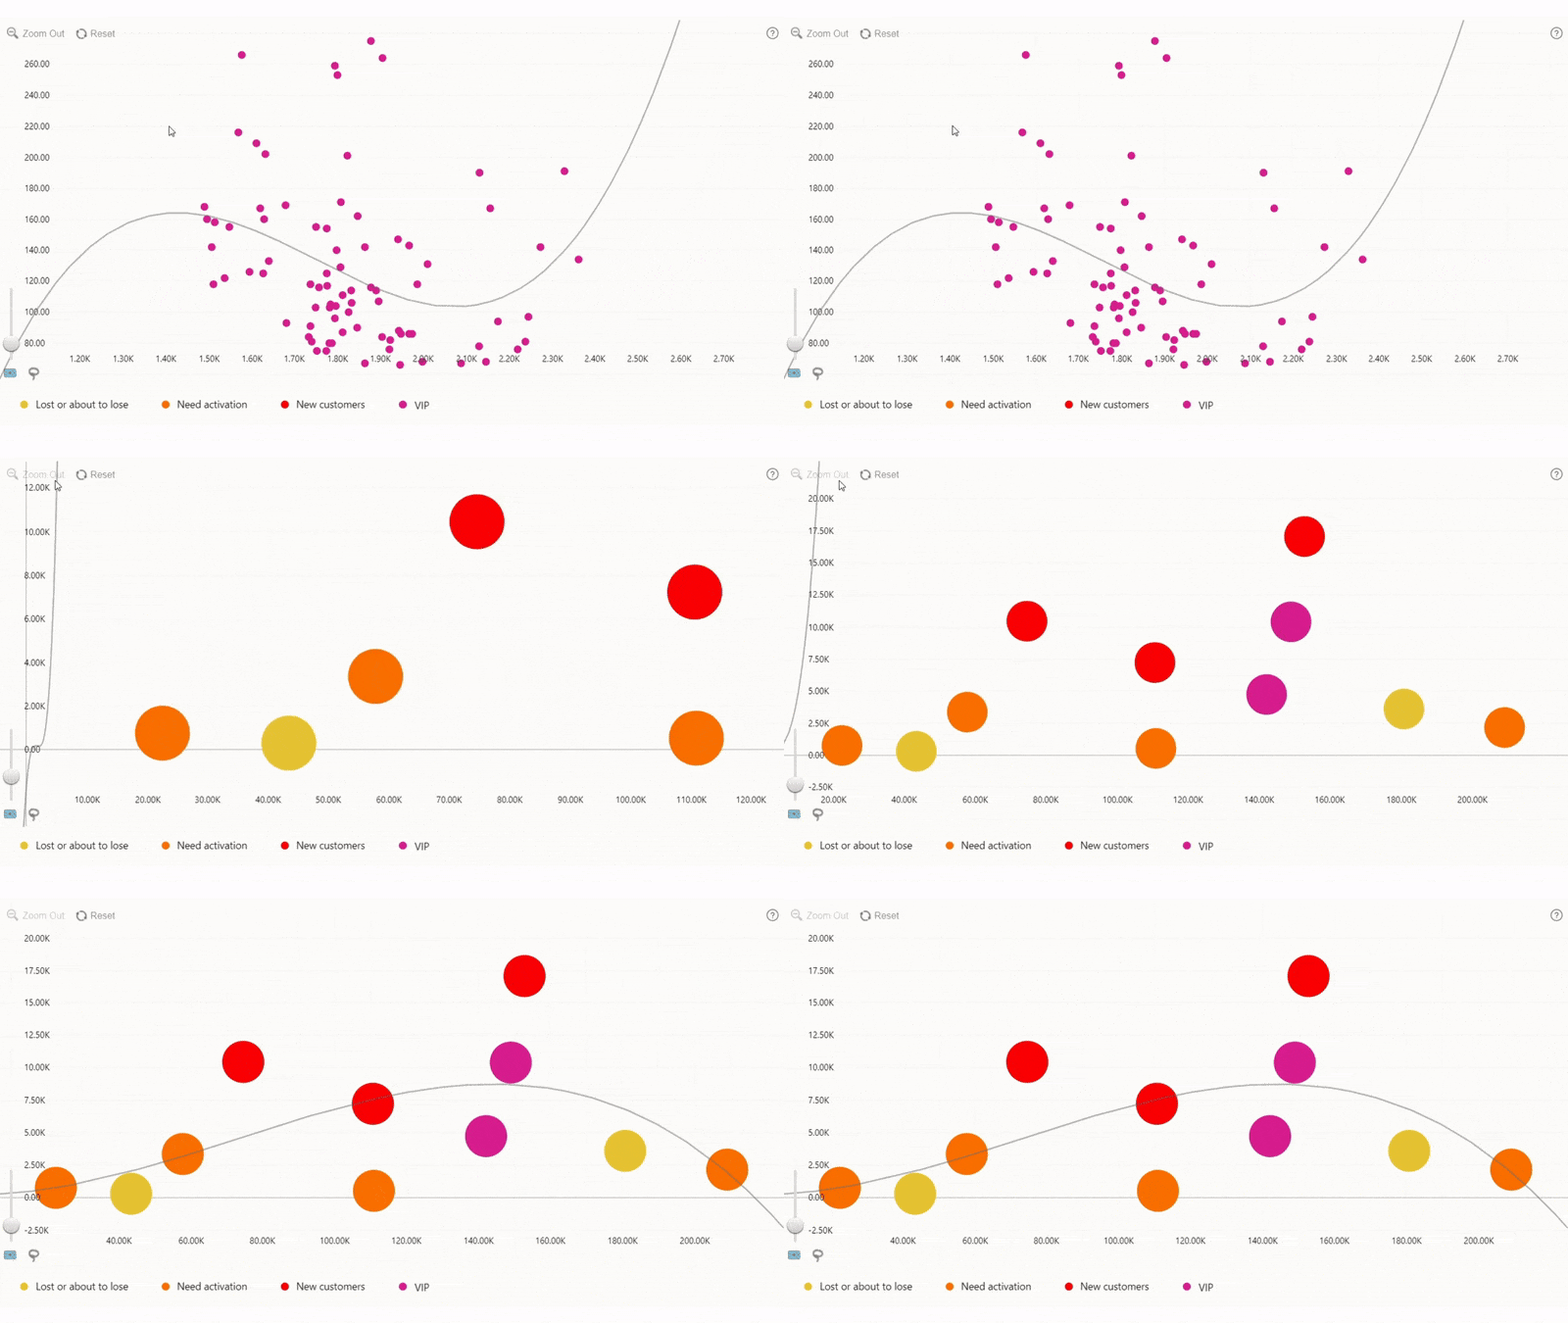
The previous level of hierarchy can be accessed by pressing
the Zoom Out button in the toolbar which can be turned on with the Enable “Zoom Out” setting.
Show/Hide Legend Groups
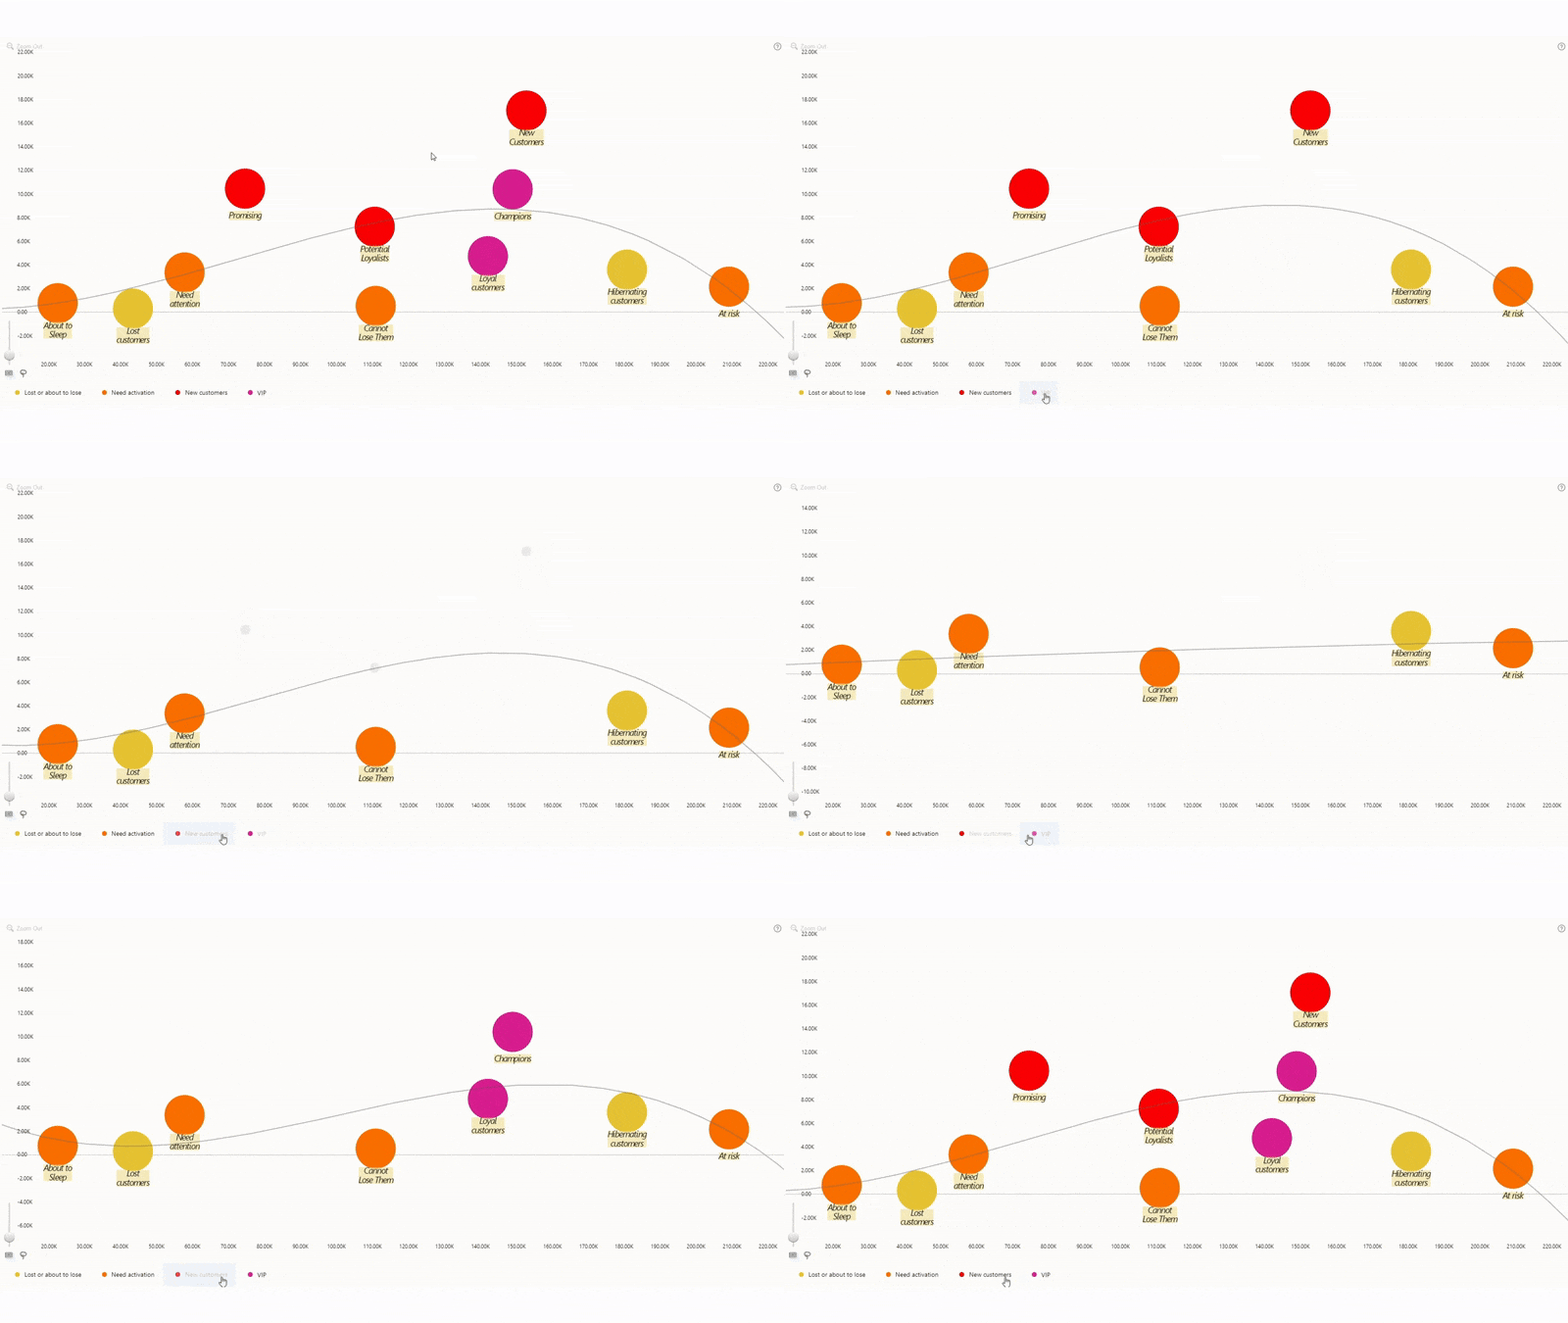
If the Legend is enabled, left-click or
tap on any legend item to show/hide all data points within that legend
group.
Reset
Undo all user interactions and revert to the initial view by
pressing the Reset button in the toolbar which can be turned on
with the Enable “Reset” setting.
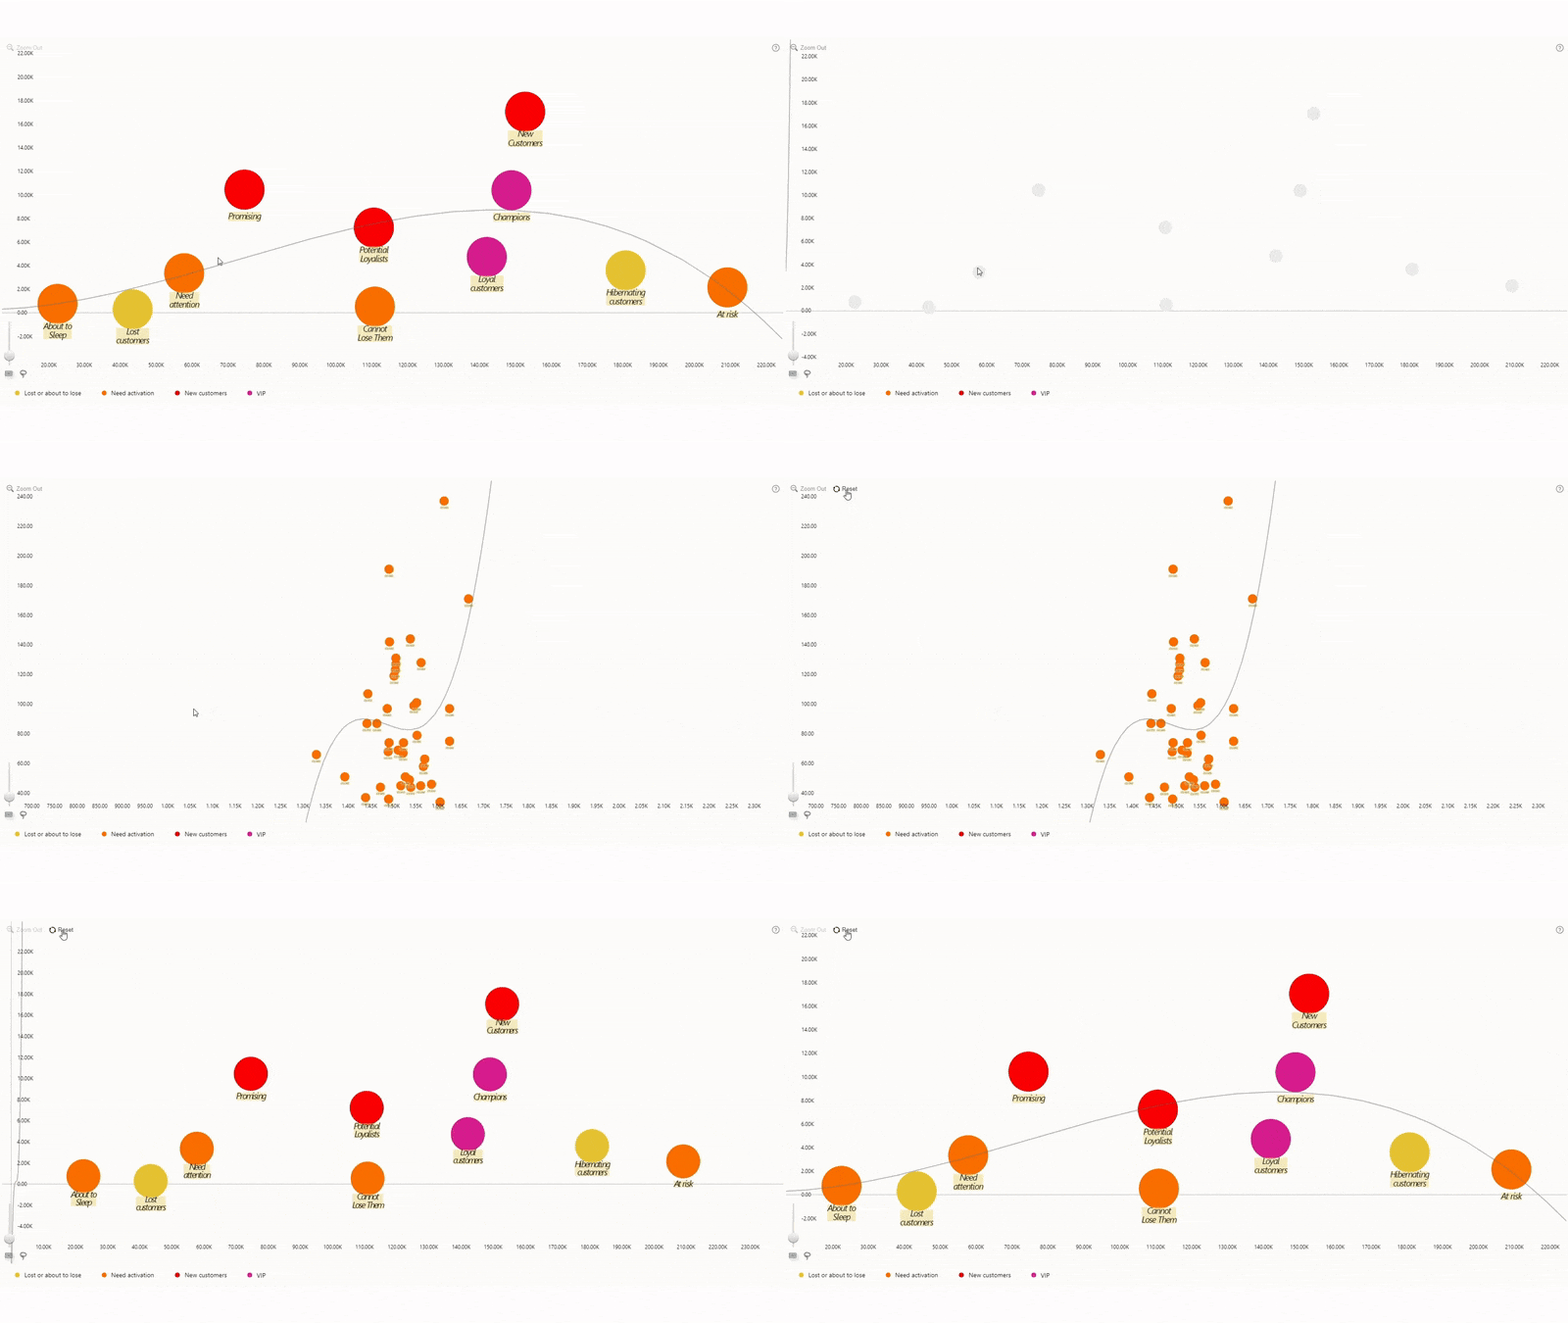
Zoom-in/Zoom-out
To increase or decrease the current zoom level, use the mouse
scroll wheel or the pinch-to-zoom gesture. Report creators can also
enable a zoom slider in the toolbar with the Enable “Zoom Control” setting.
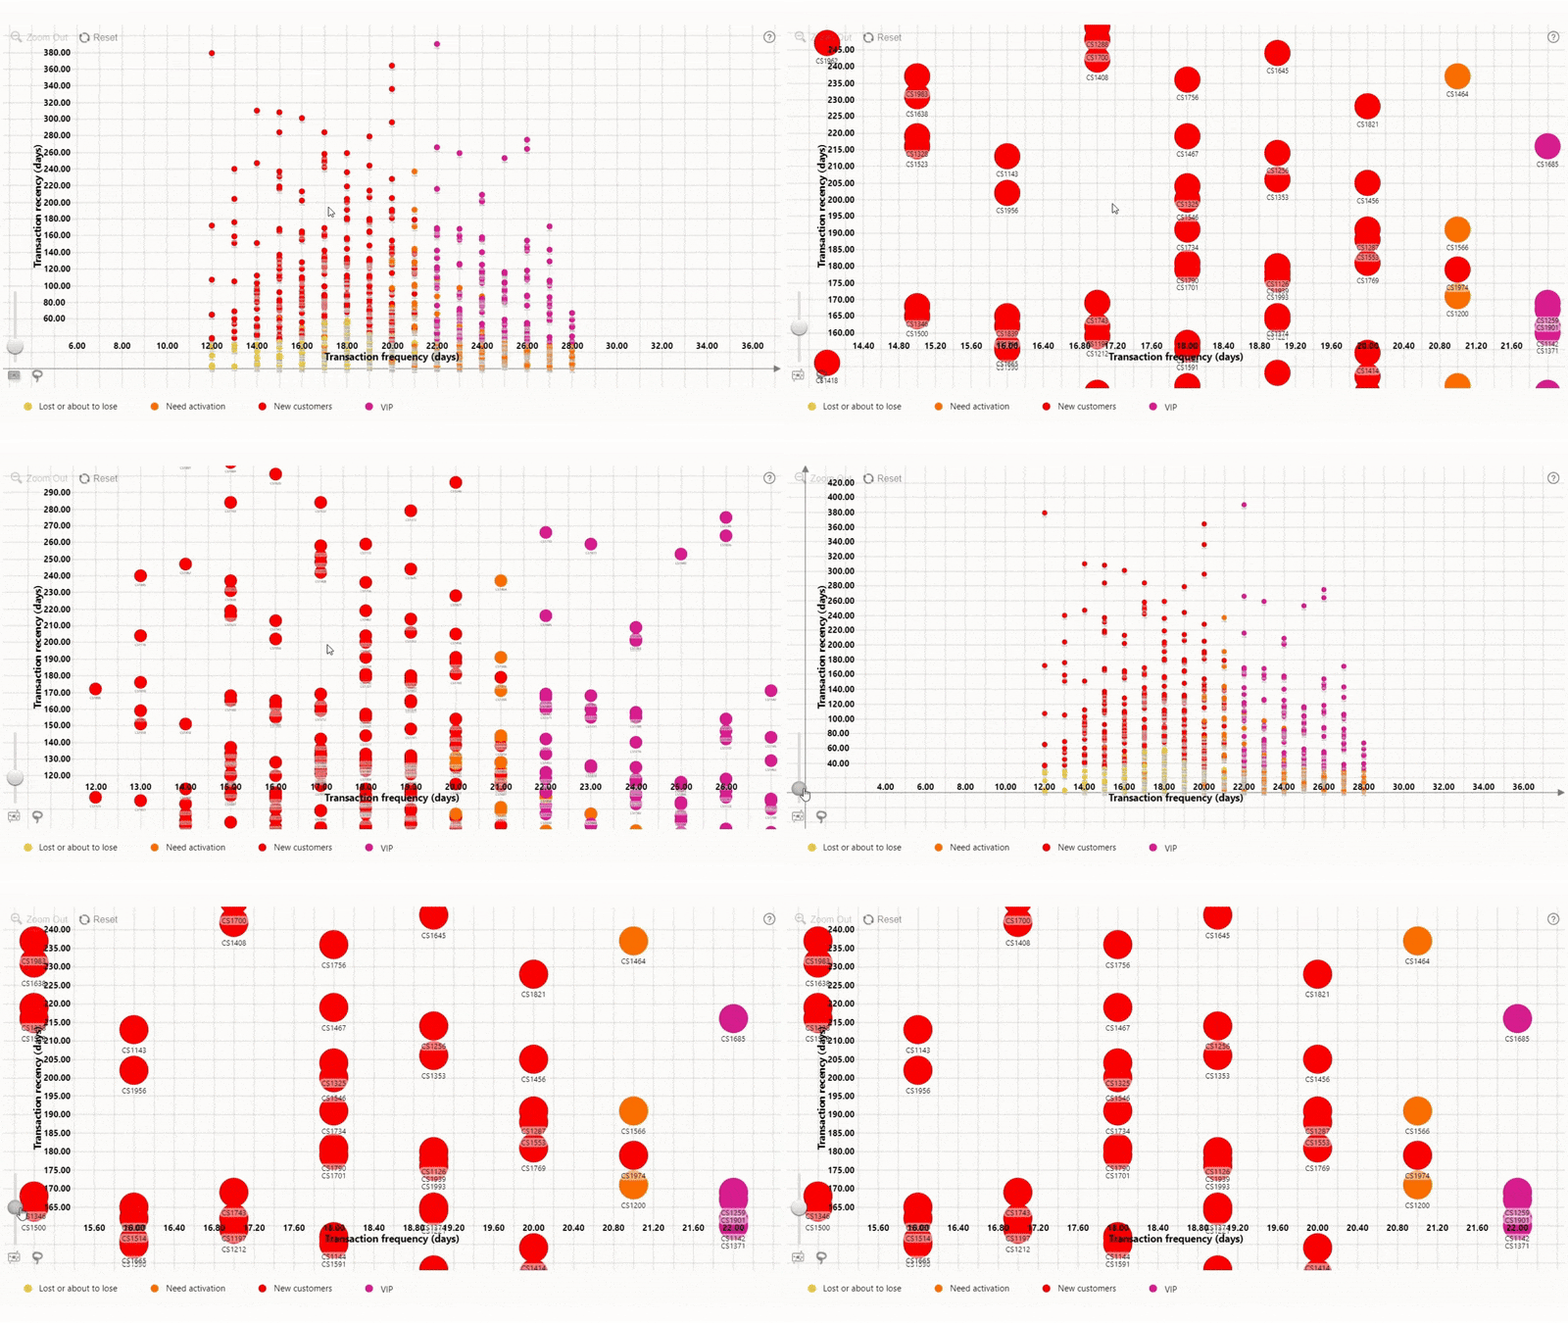
Fit To Screen
Press the Fit to Screen button on the toolbar (if it
is enabled) to automatically find a zoom level and position that displays all currently
visible data points and fits them within the viewport.
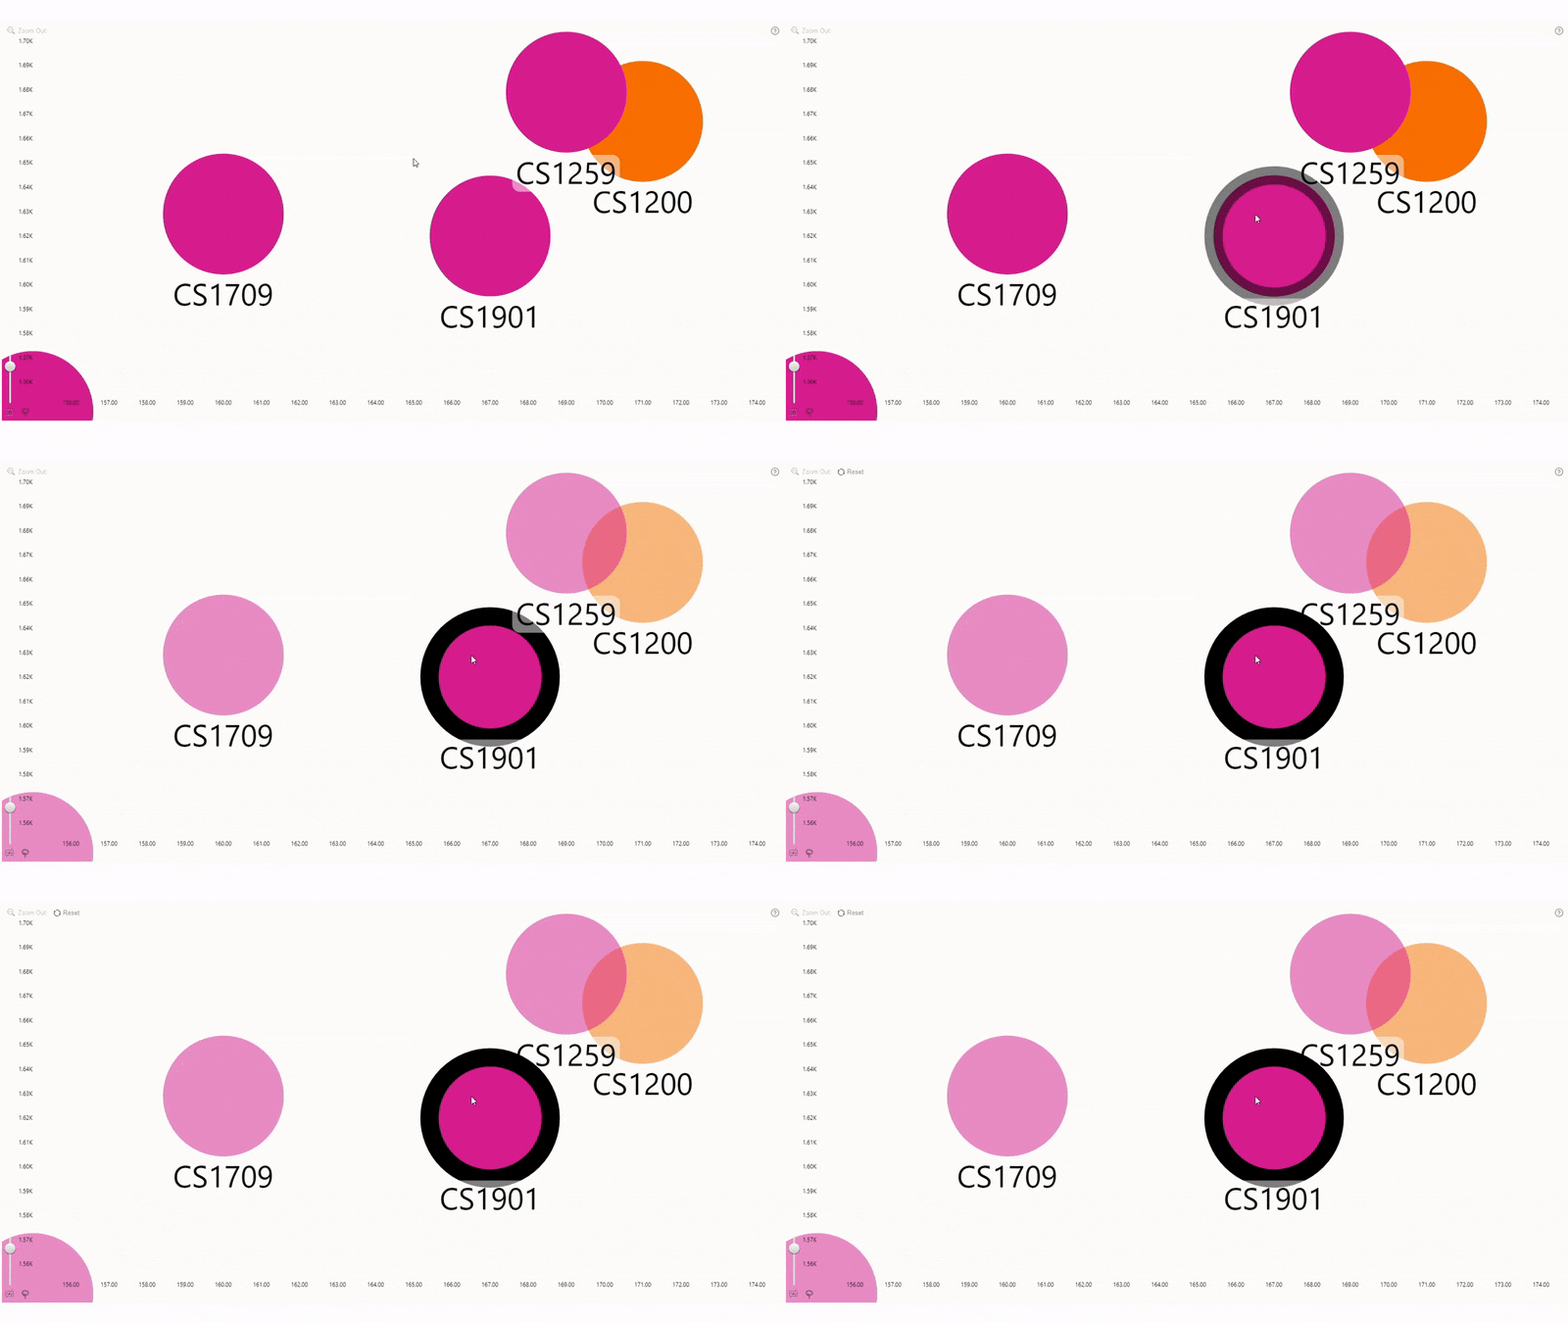
Select a Data Point
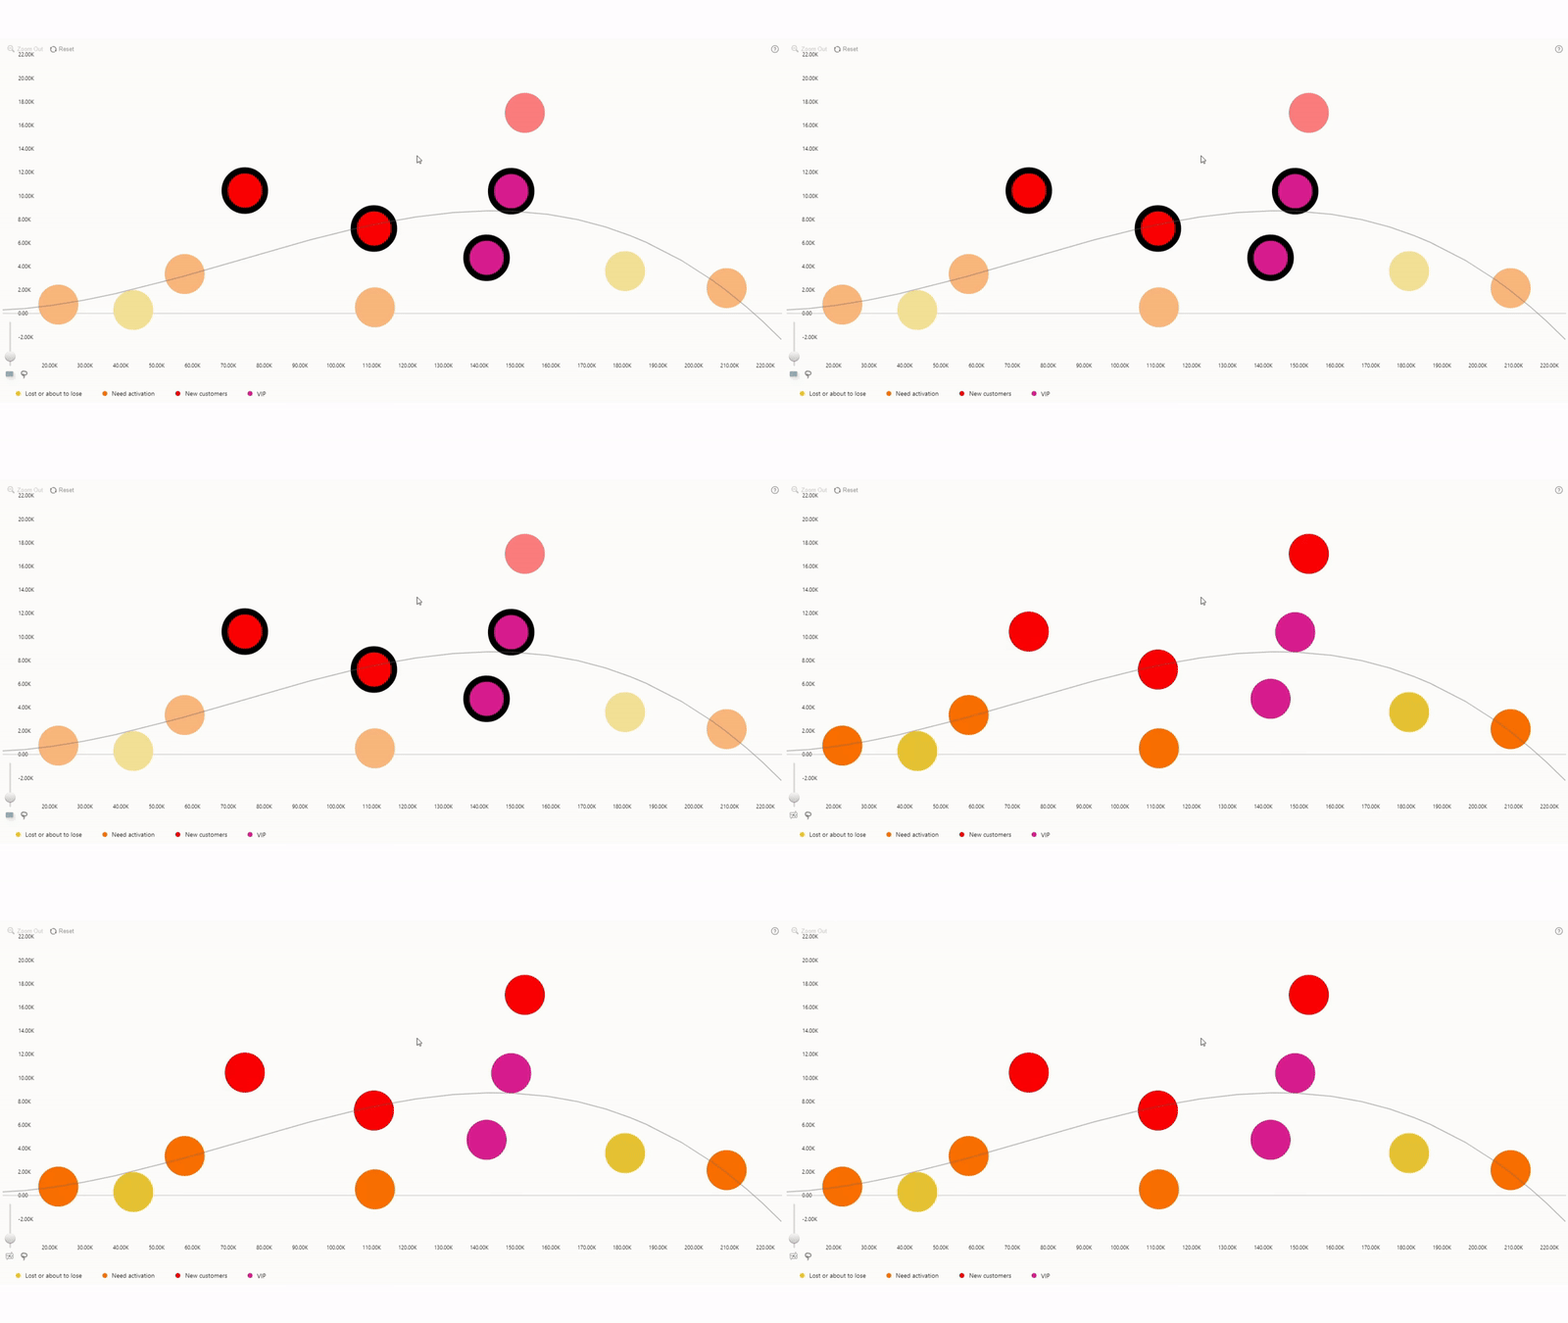
To select a single data point, click and hold the left
mouse button on its marker until you see a black border which indicates
that the data point is highlighted. If you are at the final or only level of
hierarchy, left click will select a data point.
Clear Selection
To clear your selection, left-click or tap on
any empty area.
Add To Selection
To add another data point to your selection, click and
hold the left mouse button while holding the CTRL key or Shift.
Rectangular Selection
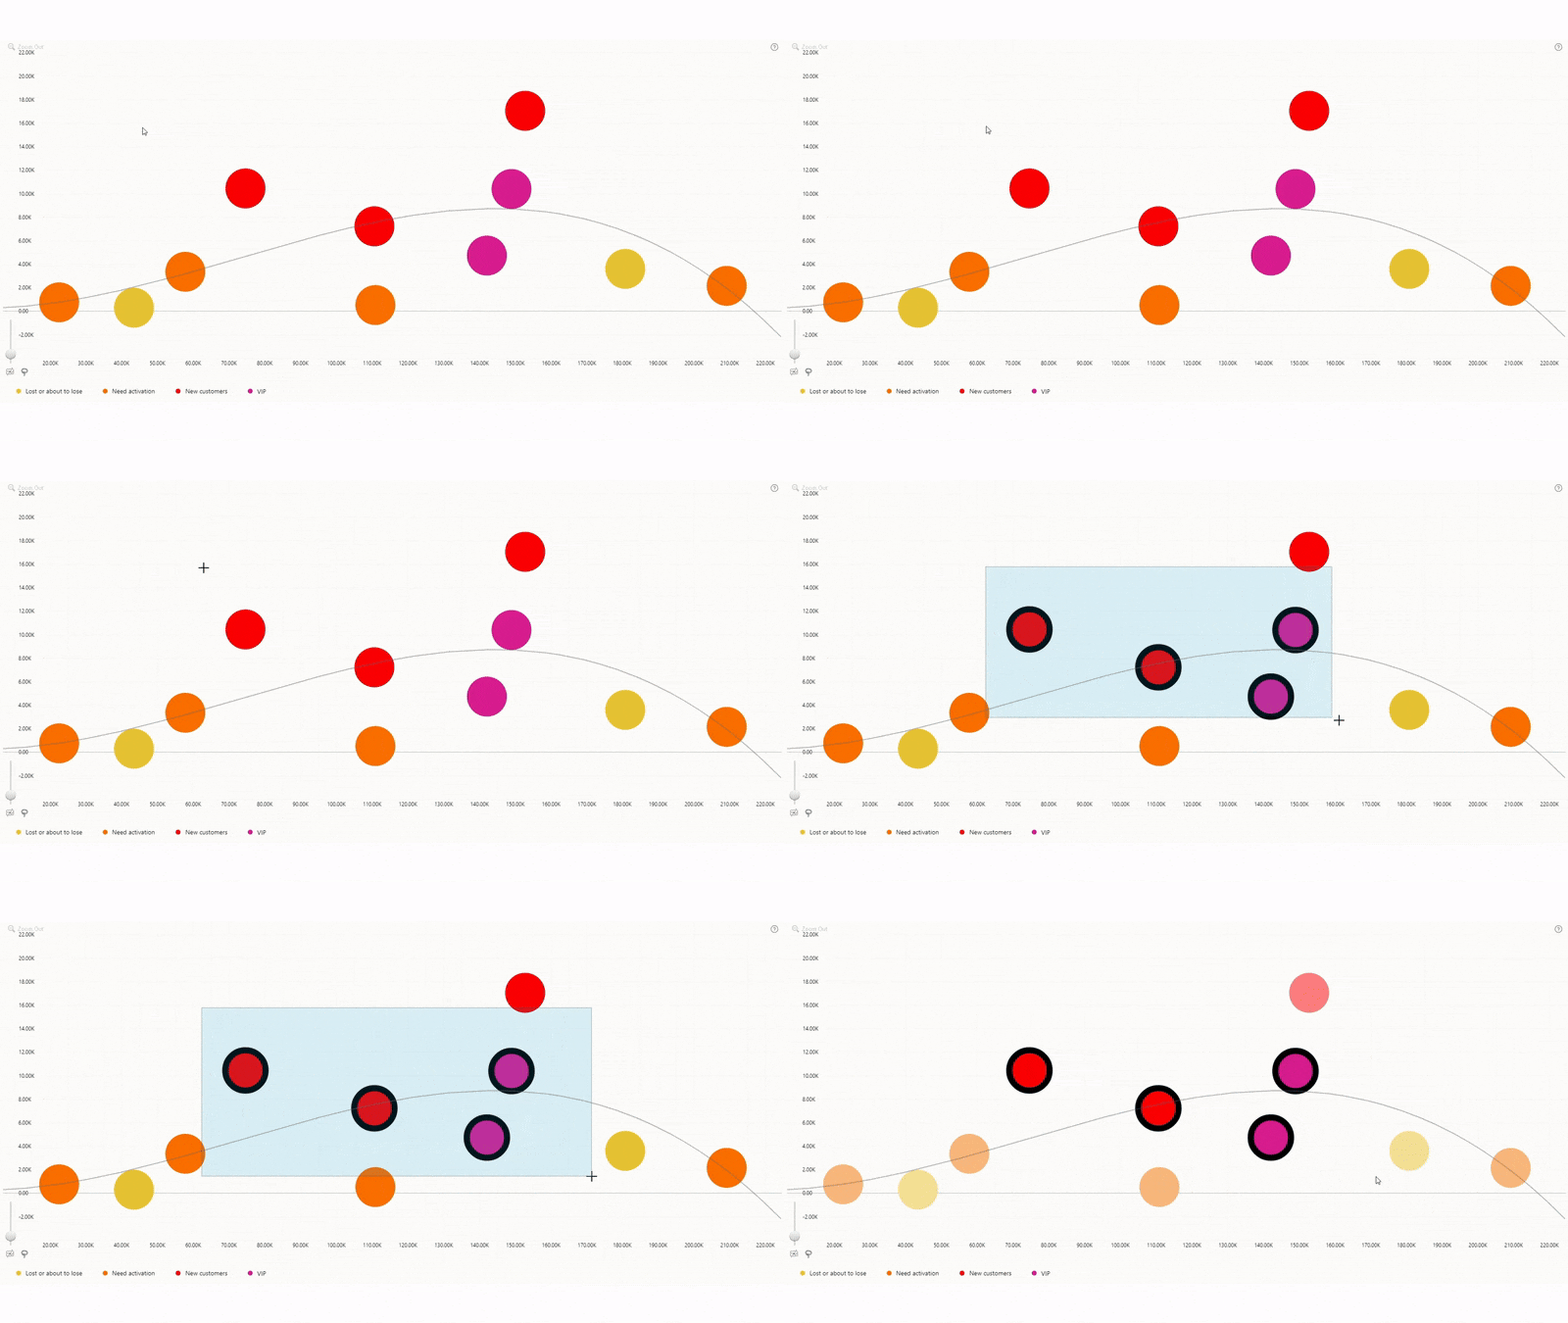
To select multiple data points, click and hold the left mouse button on an empty area until the mouse pointer changes to a crosshair, and drag the mouse while holding the left click to draw a rectangular selection. For touch devices, tap and hold and then drag.
Lasso Selection
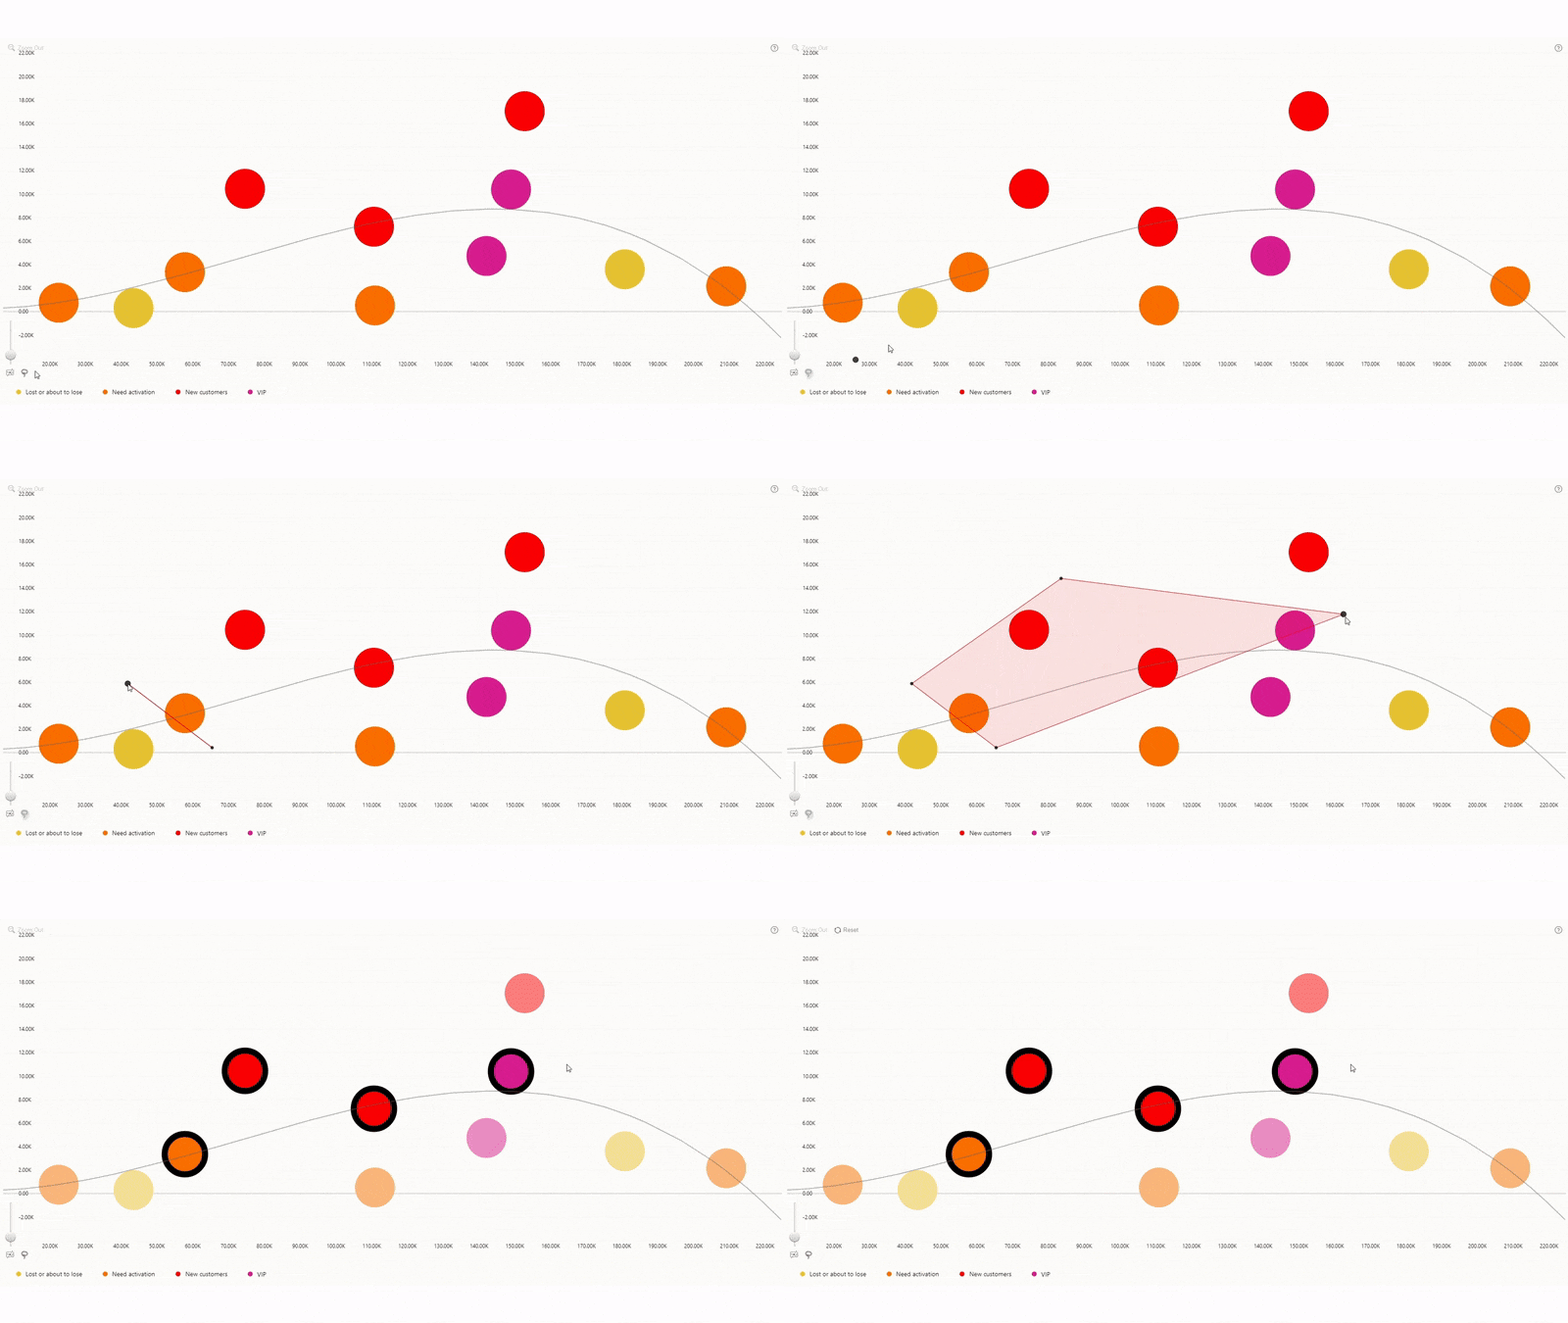
Multiple data points can also be selected by pressing the
Lasso Tool button in the toolbar (if it is enabled). While the lasso
selection mode is active, left-click or tap on the chart to add
an anchor point. Once you have created your desired shape, press the Lasso
Tool button again or the Enter key to turn it into a selection area.
Was this helpful? Thank you for your feedback!
Sorry about that.
How can we improve it?