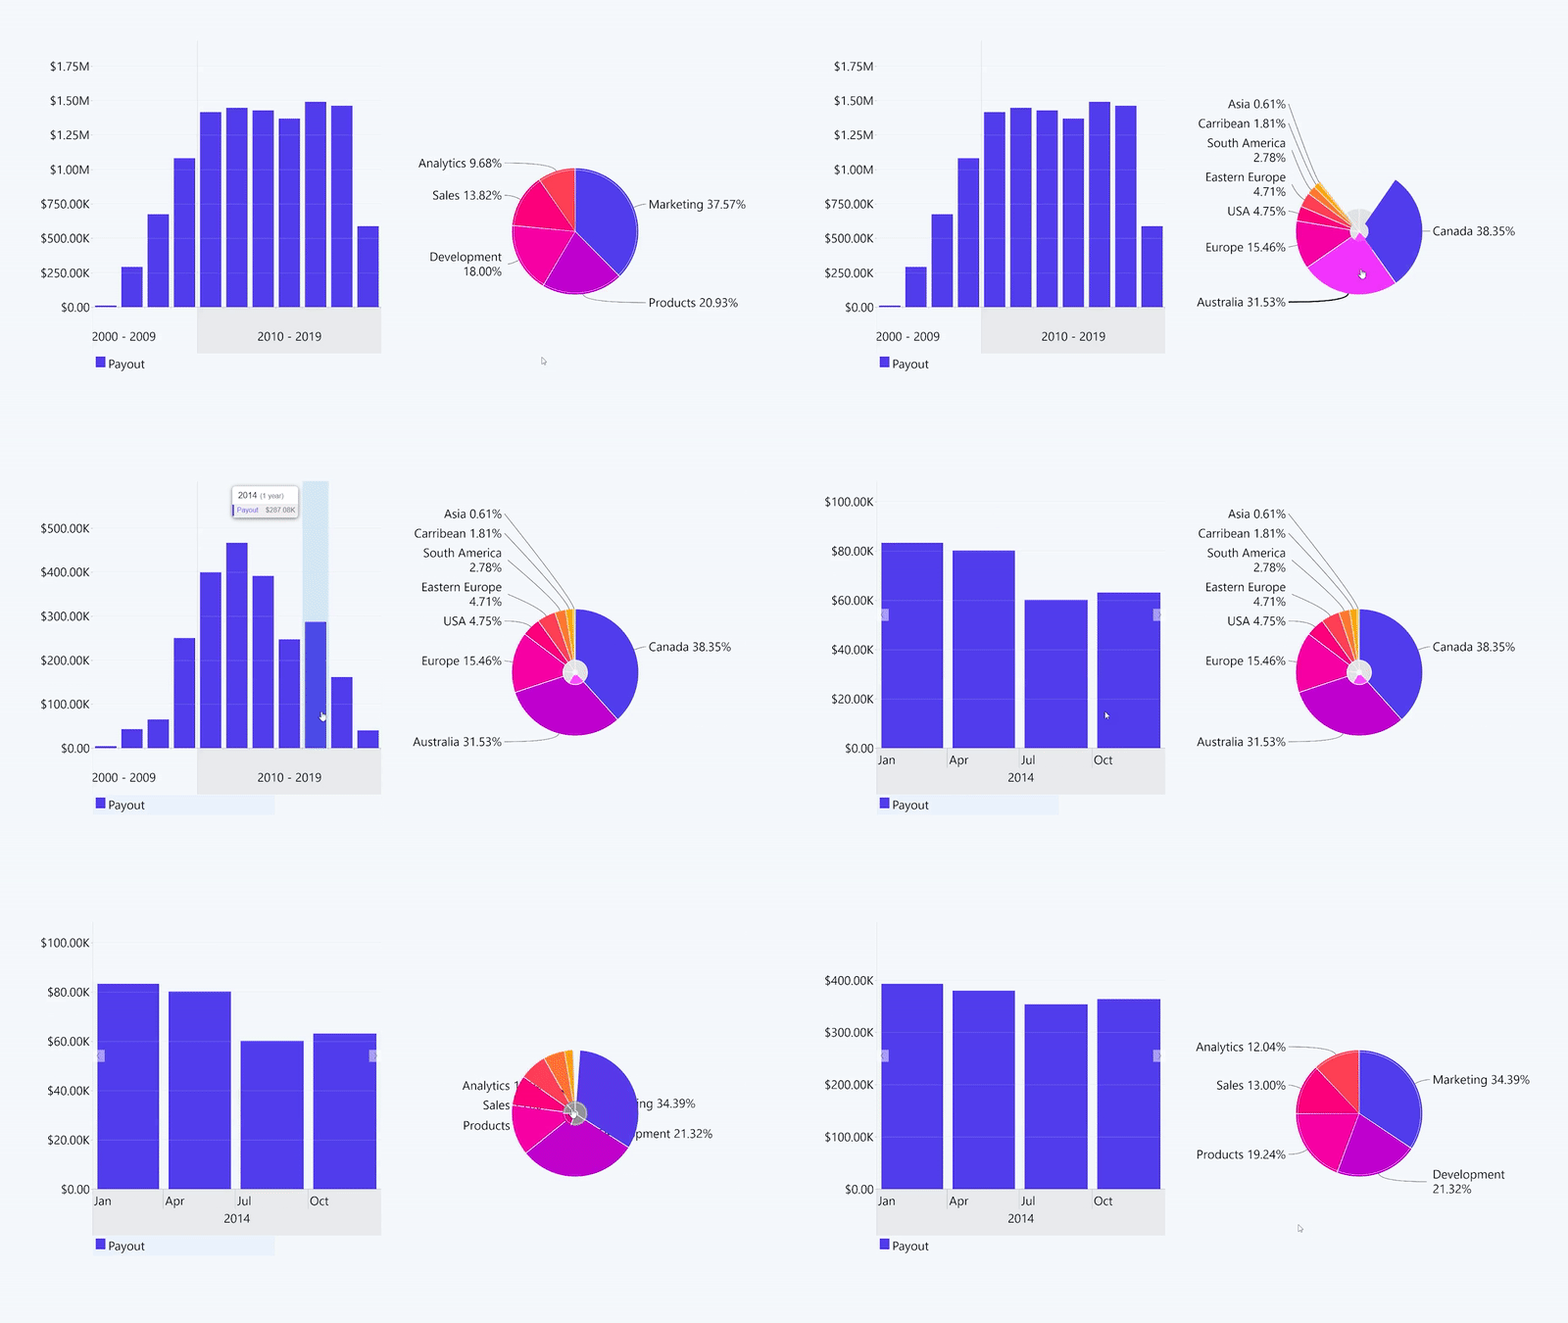
Create a more connected report experience with cross-chart filtering. Drill Down Pie PRO can interact with other visuals on the same report page, helping users explore data across multiple visuals at once.
When cross-chart filtering is enabled:
- Selecting a slice or drilling down in the pie chart filters the data shown in other visuals.
- Interacting with other visuals applies the same filter context to the pie chart.
You can enable this behavior in the Format visual pane by turning on Use as Filter.
Cross-visual interactions behave differently in Drill Down Pie PRO (Pin). For details, see the Pin version differences documentation.
Was this helpful? Thank you for your feedback!
Sorry about that.
How can we improve it?