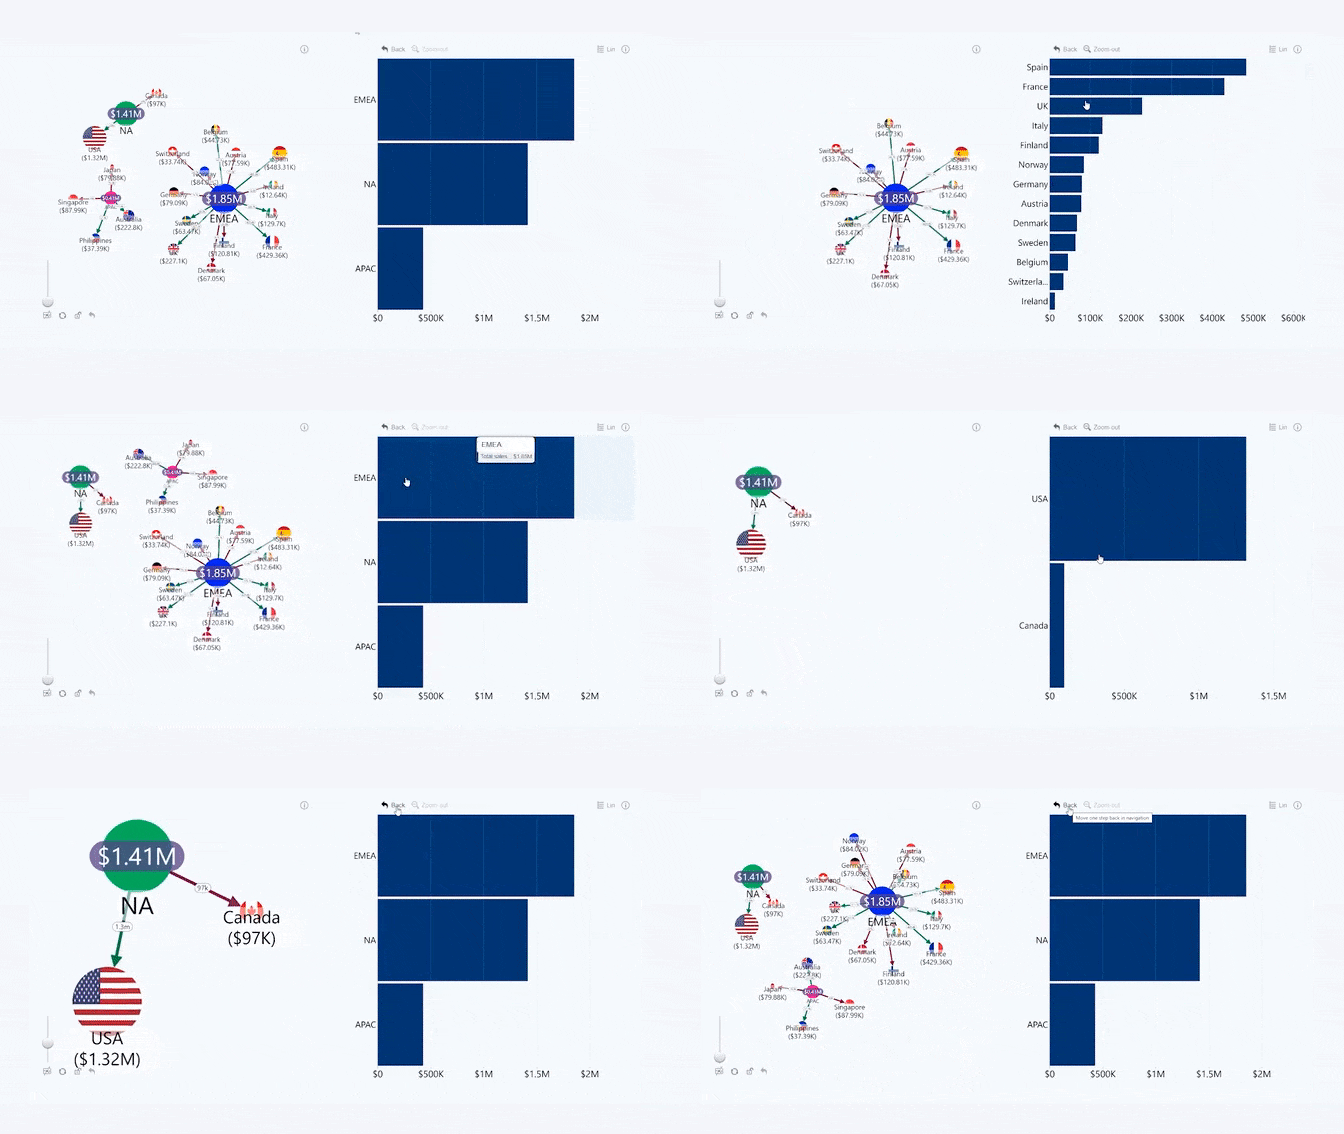
Cross-Chart Filtering
Network PRO can interact with other visuals on your report, enabling a dynamic and engaging data exploration experience for your users:
- Selecting one or multiple nodes on your network chart will also apply a filter on other visuals.
- Interacting with other visuals will apply the same filters to your network chart.
If the Highlighting toggle in the Format Visual tab is enabled, selections in this visual will cross-filter other visuals on the report page.

Was this helpful? Thank you for your feedback!
Sorry about that.
How can we improve it?