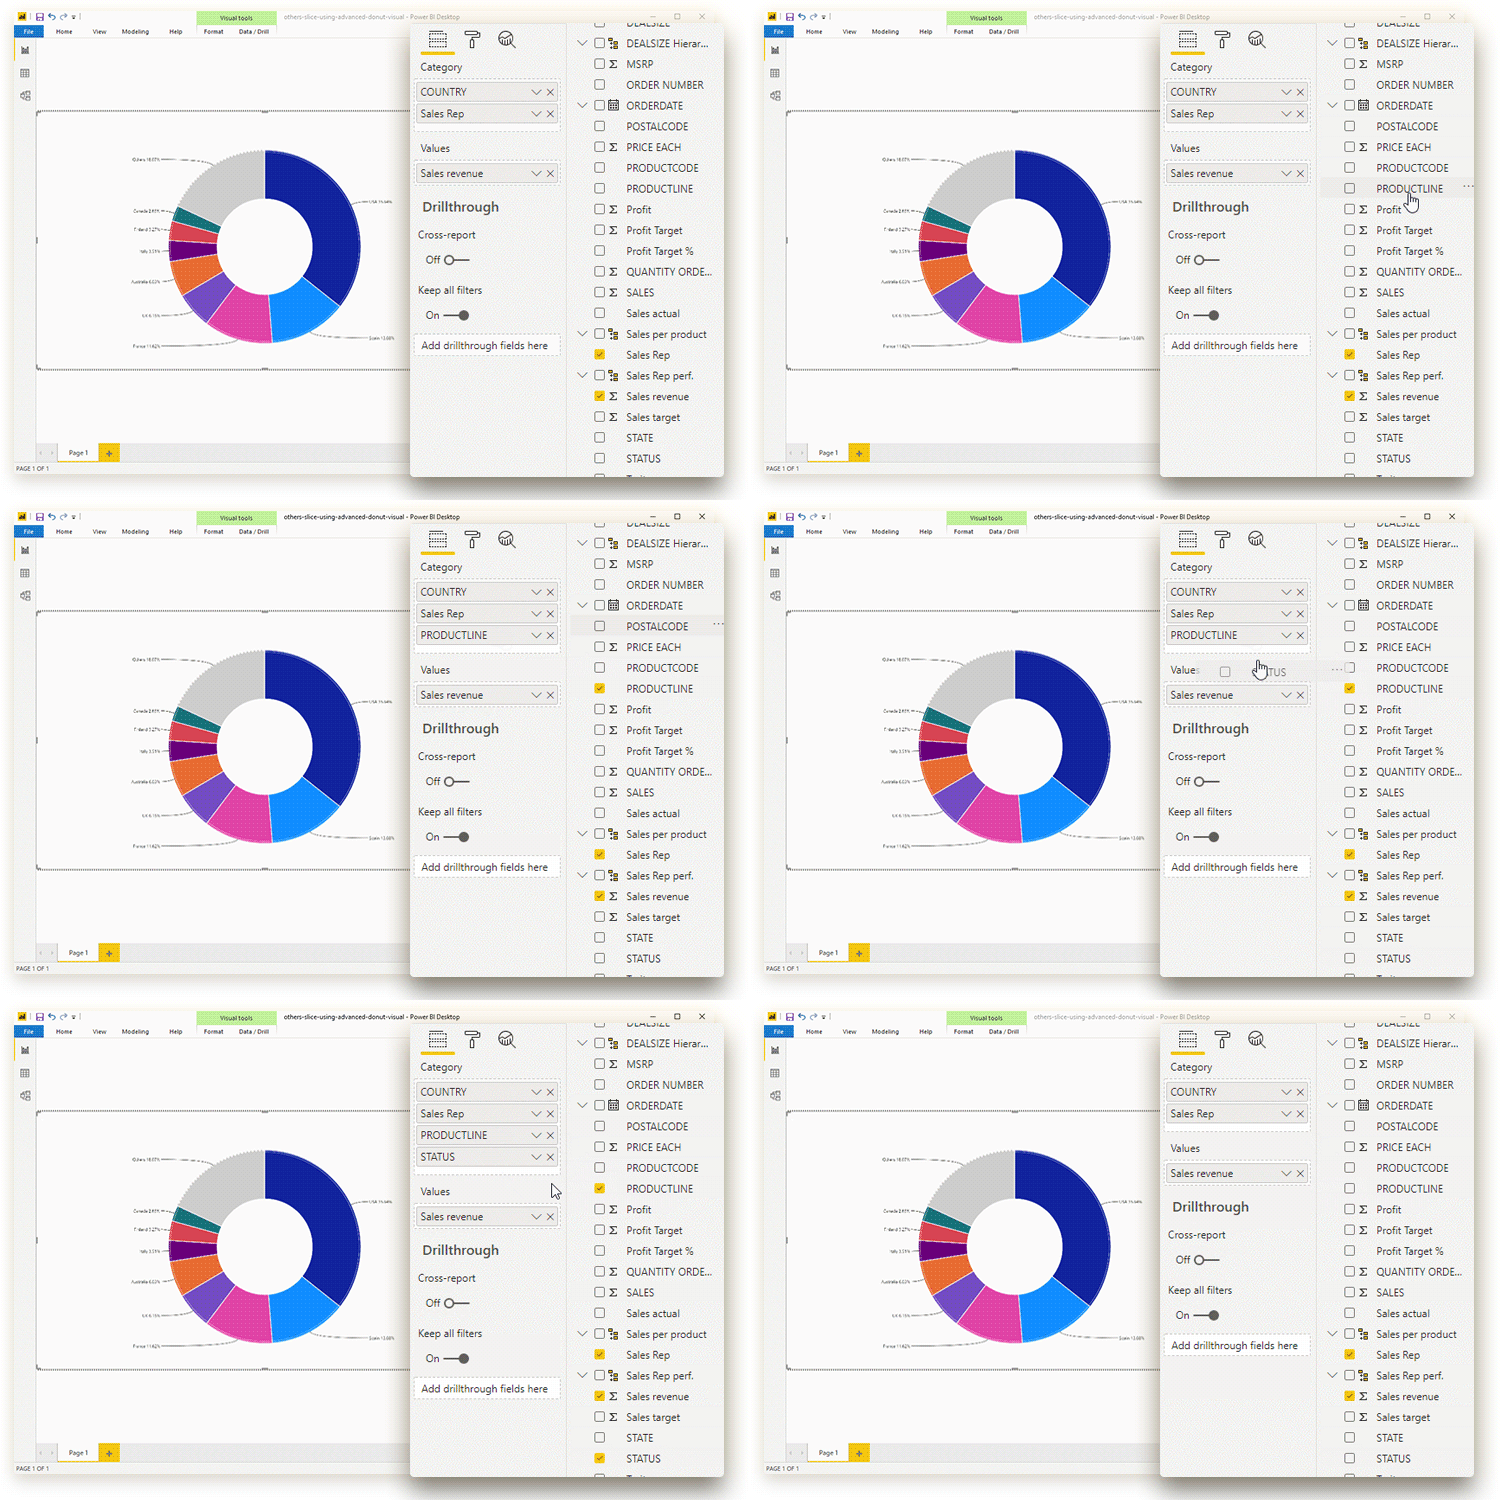
Category
Category field defines the list and order of levels that the chart will display automatically.
Category field supports different types of Columns:
- Text
- Numbers
- Date
- Symbols
Adding columns to the field is easy: simply check the box next to the column in the Fields pane; or drag and drop them in the desired order.
The below example shows a donut chart with five different categories. The chart will use these categories to create five levels of drill down. The order will be the same as specified in the Category field – in this example, Region -> Department -> Title -> Seniority -> Name.

Was this helpful? Thank you for your feedback!
Sorry about that.
How can we improve it?