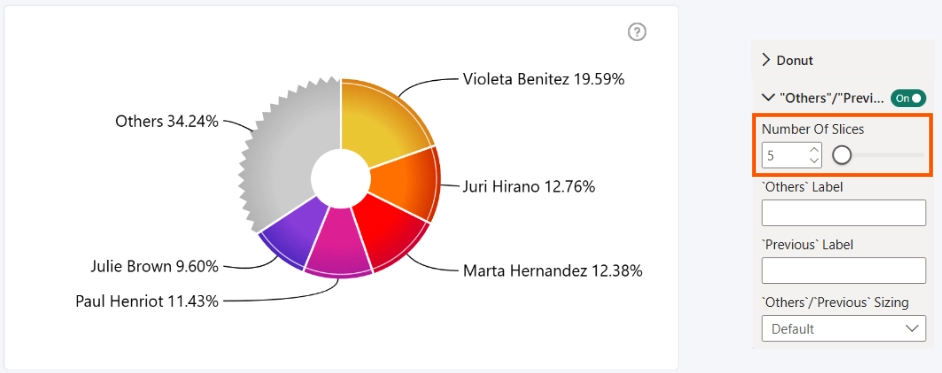
This formatting option lets you control how many slices are displayed in the chart. Any remaining categories will be grouped into an Others slice.
The Others slice is created only when at least two categories are grouped together.
By default, the value is set to 5, but it can be adjusted between 1 and 30.
Was this helpful? Thank you for your feedback!
Sorry about that.
How can we improve it?