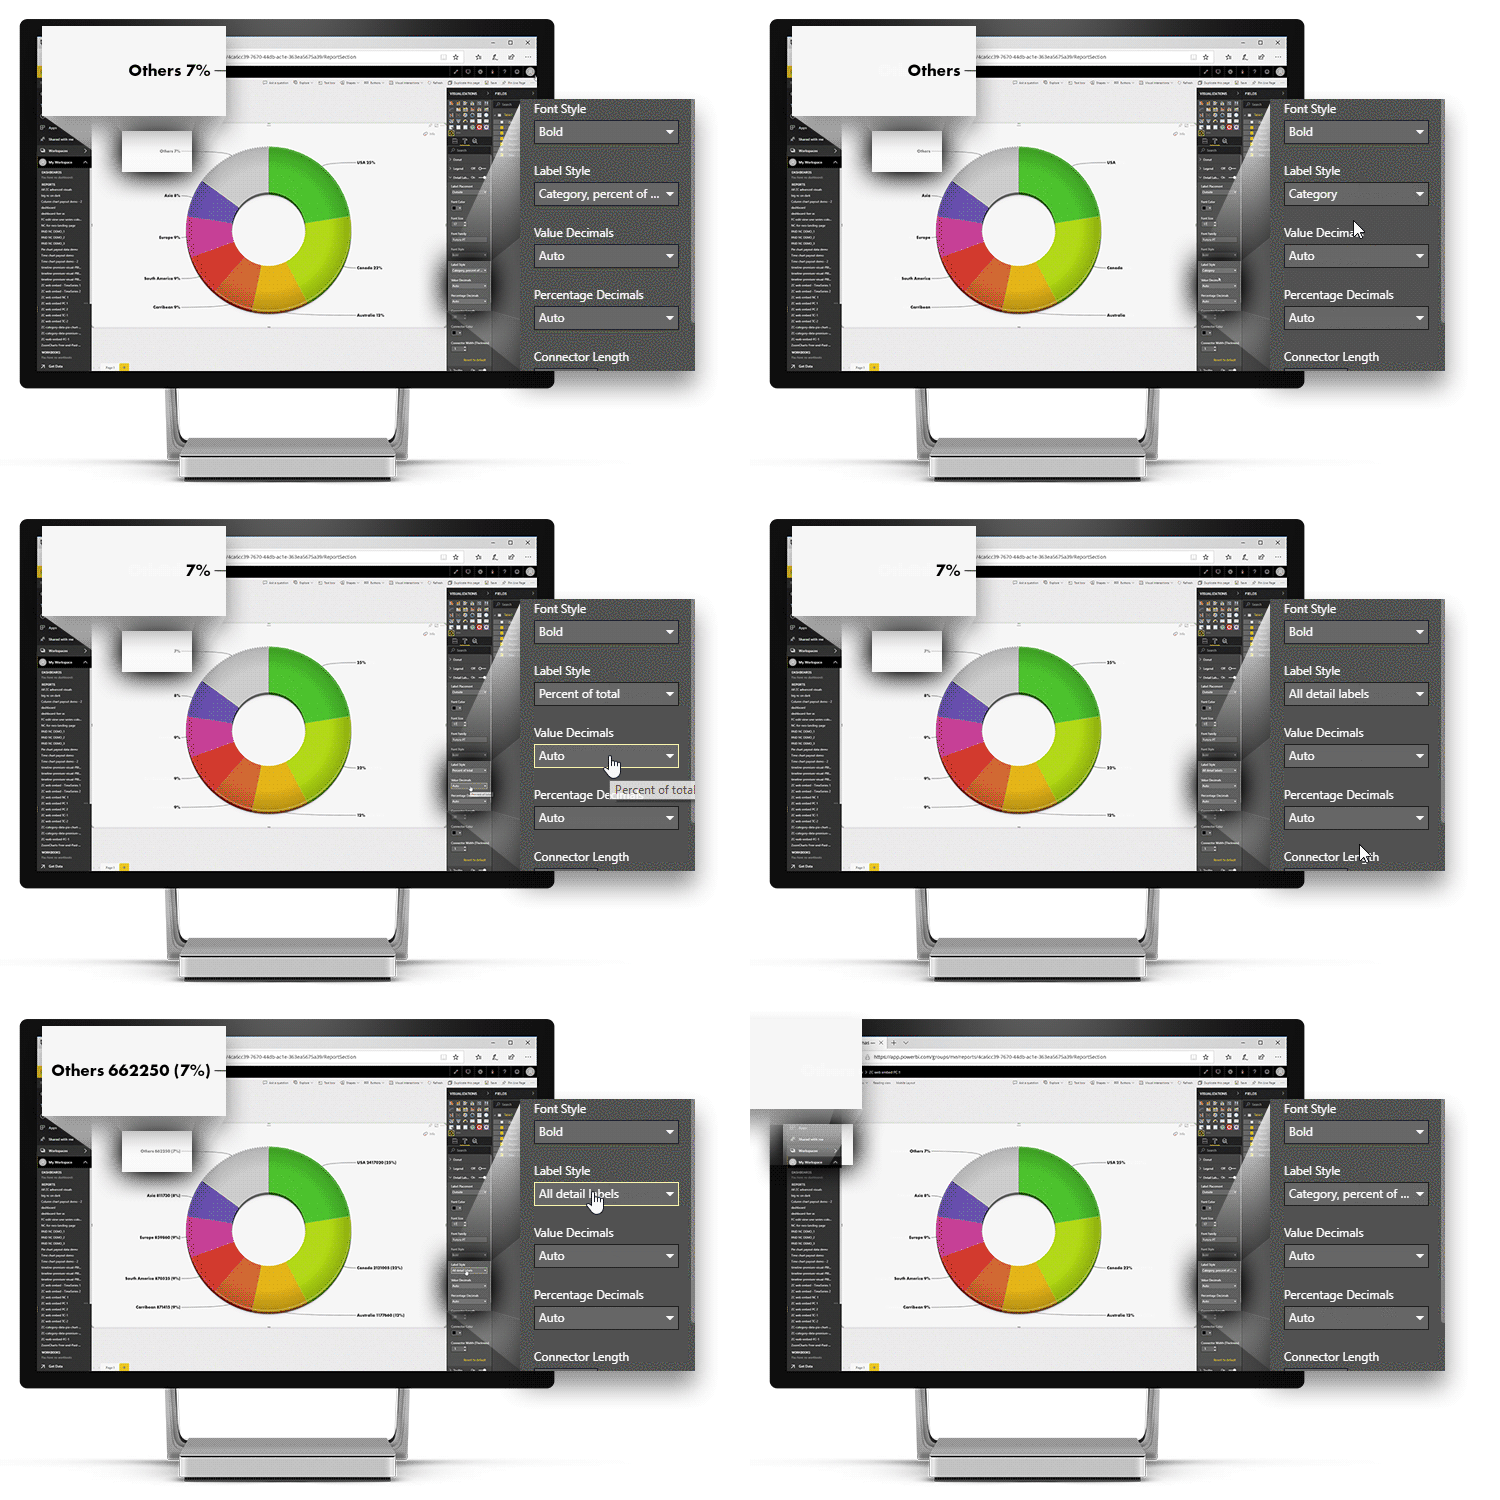
Label Style
This property determines the content displayed by the detail labels. You can choose between the following options:
- Category: display only the category names for each slice (example – “Germany”).
- Data Value: display only the values for each slice (example – “€245,430”).
- Percent of total: display only the slice’s percentage against the entire donut chart (example – “24%”).
- Category, data value: display category names and data values (example – “Germany, €245,430).
- Category, percent of total (default setting): display category names and their percentages (example – “Germany, 24%”).
- Data value, percent of total: display the data values and percentages of each slice (example – “€245,430, 24%”).
- Category, data value, percent of total: display all three elements in the detail labels (example – “Germany, €245,430, 24%”).

The default position for data labels is outside, but it can be changed under Label placement property
Was this helpful? Thank you for your feedback!
Sorry about that.
How can we improve it?