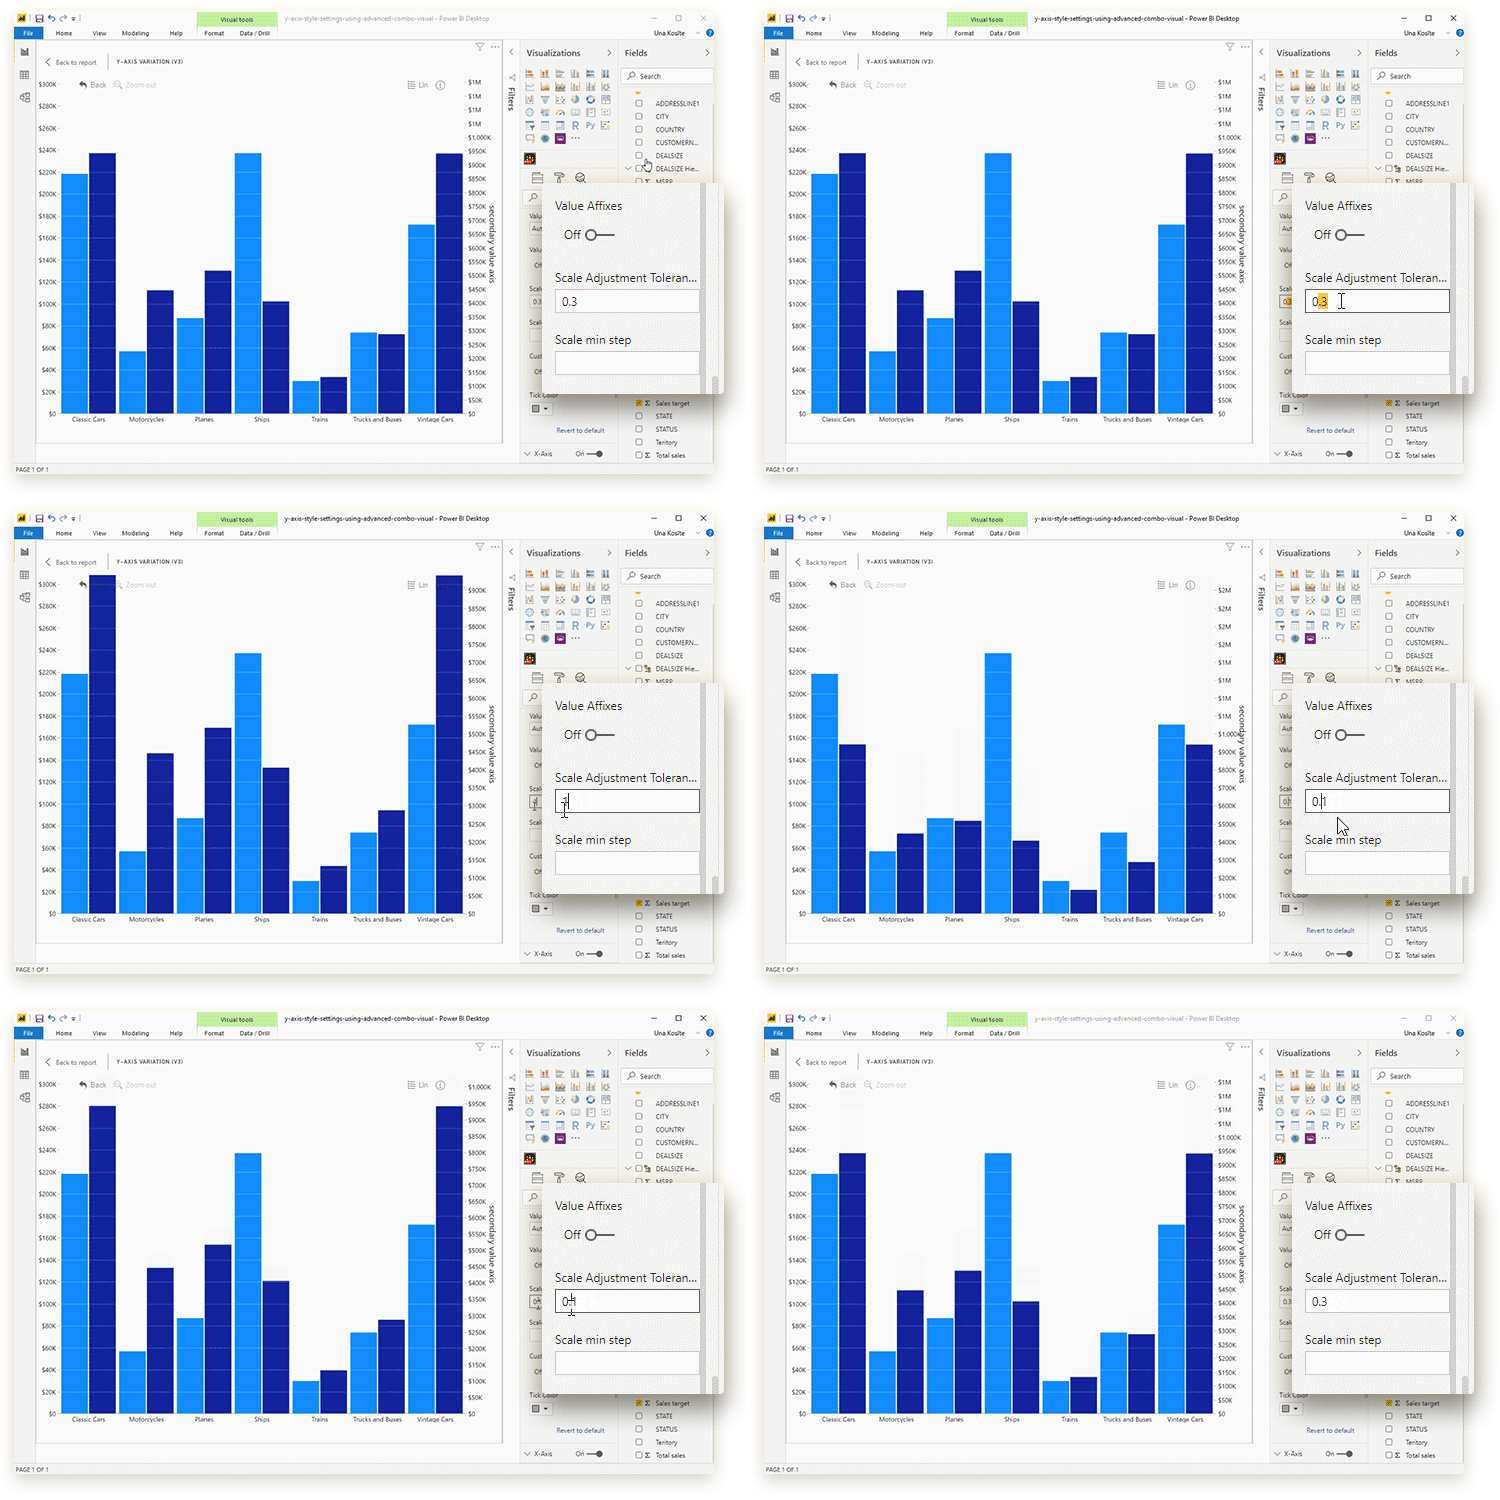
Scale Adjustment Tolerance
This setting allows extending Y axis beyond the value range required to display the particular data to leave extra space above and/or below data. Format: decimal value between 0 and 1. For example, setting to 0.5 will add additional 50% of height to the Y axis compared to the data values (if max value = 100, Y axis will be limited at 150).

Was this helpful? Thank you for your feedback!
Sorry about that.
How can we improve it?