Interactivity
Drill Down
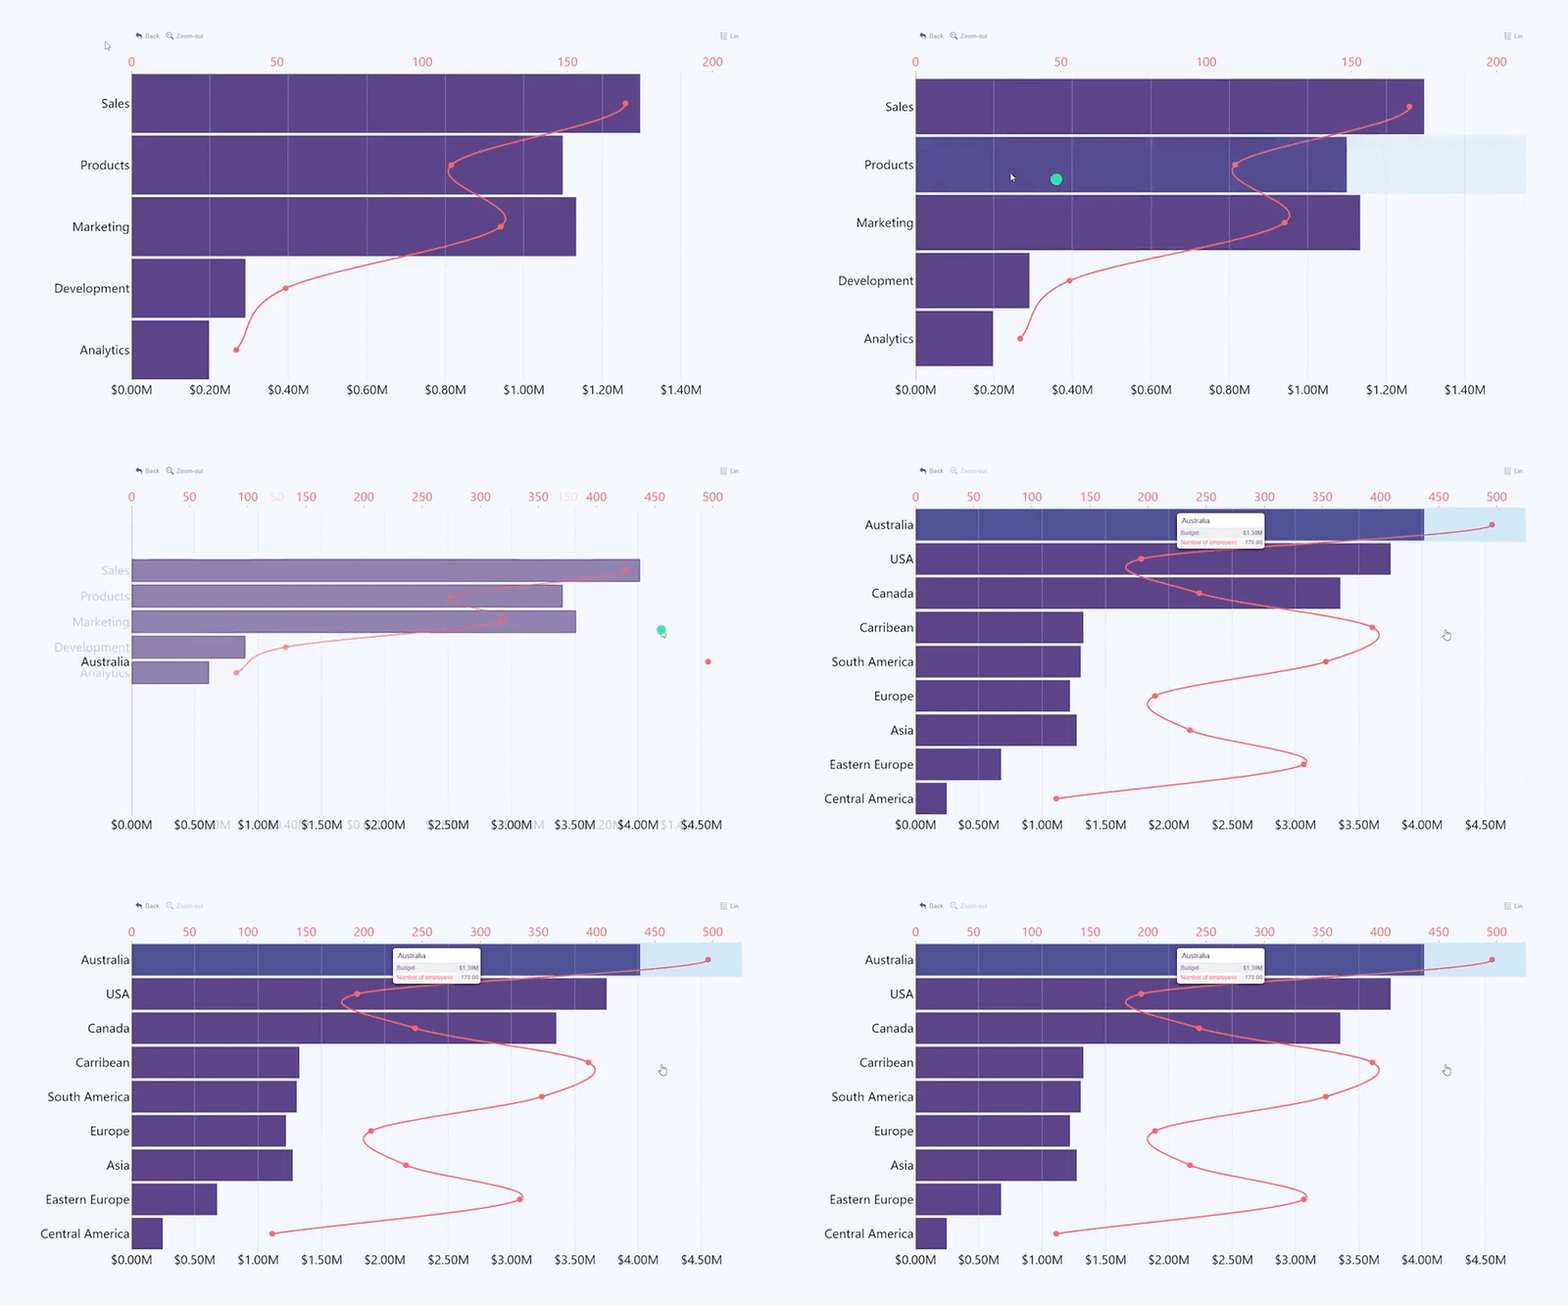
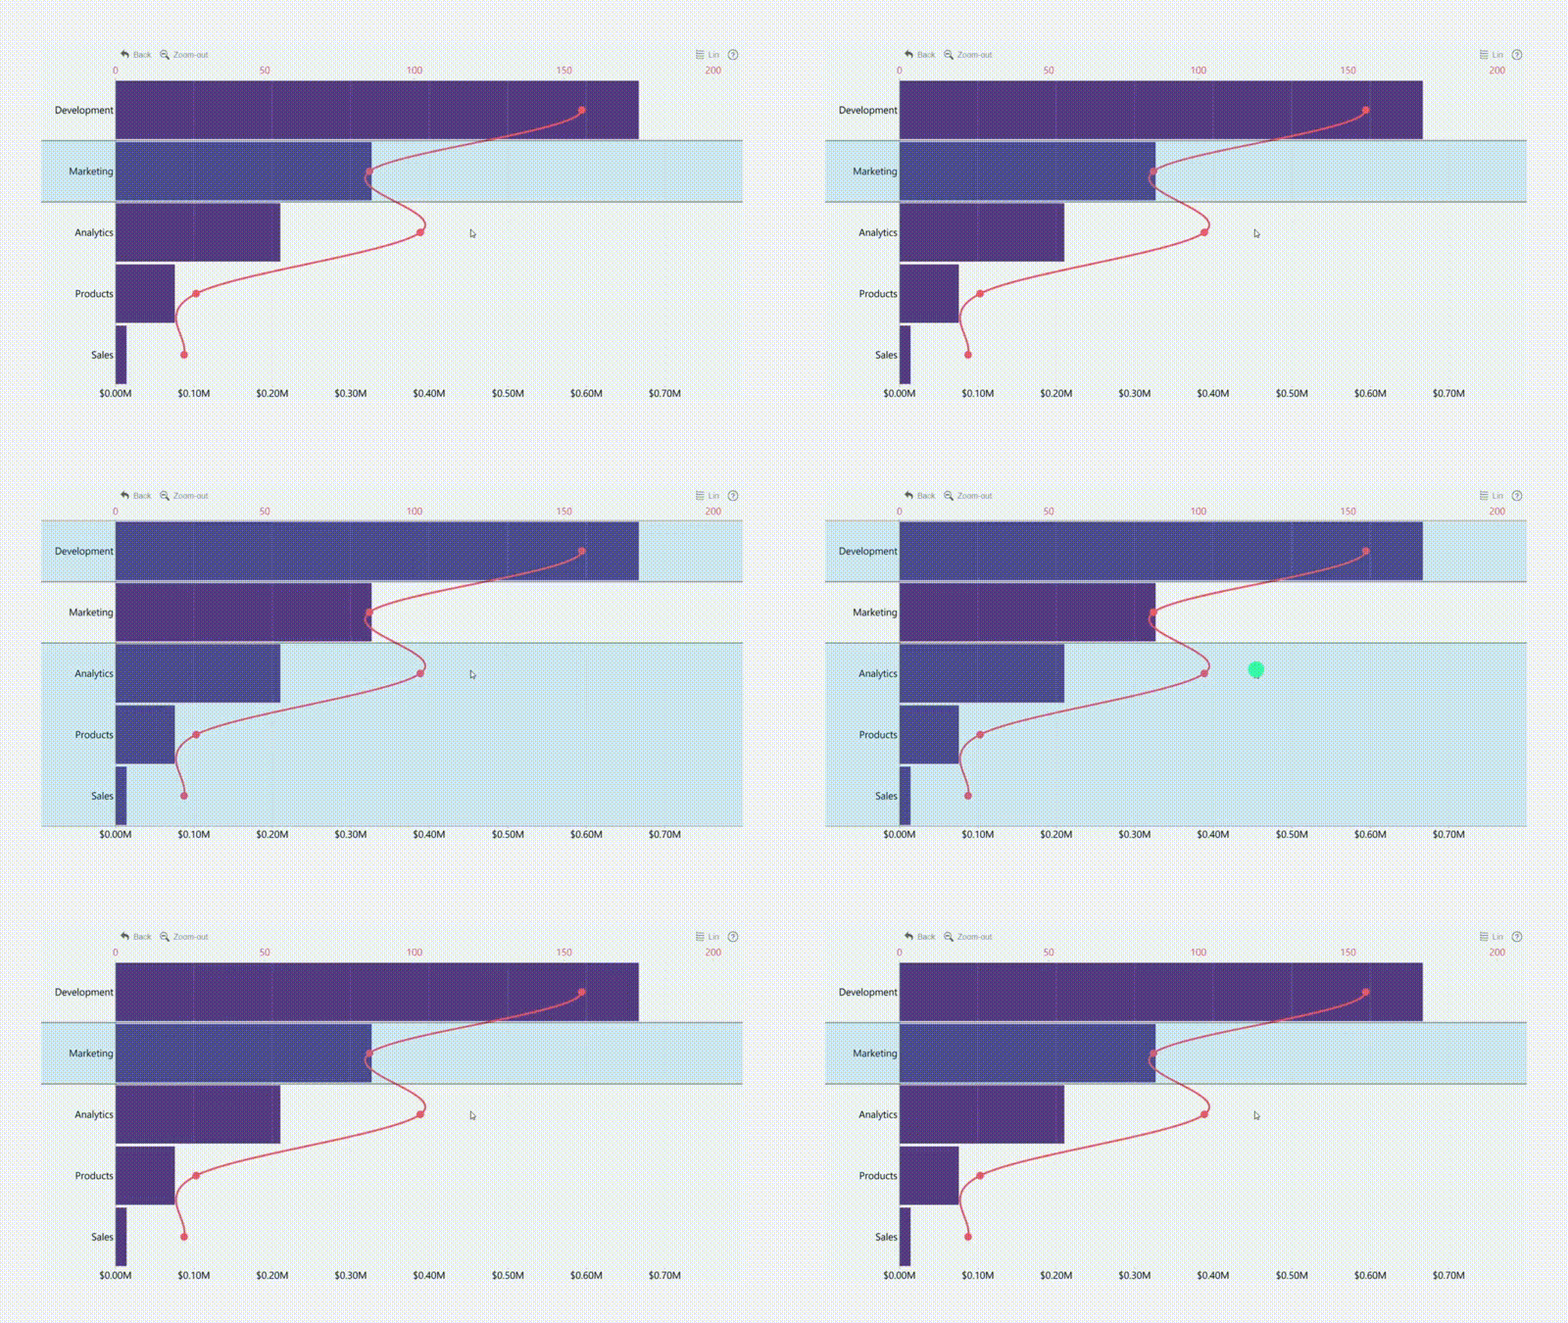
To drill down to the next hierarchy level, click or tap on a data point on the chart.
.gif)
Drill Up
To go back one level, click anywhere on the chart and drag up until you see the drill-up animation. You can also drill up by using the Zoom-out button on the toolbar of the visual.
Go back
Use the "Back" button on the toolbar (if it's enabled), which will undo the last interaction with the chart.
.gif)
Pan / zoom
Click + Drag left to zoom in. Click + Drag right to zoom out. Hold left/right click while dragging up/down to move the Y-Axis up or down and reveal more data. You can also adjust the visible Y-Axis range with the navigation arrows (if they are enabled).
.gif)
Toggle linear or logarithmic scale
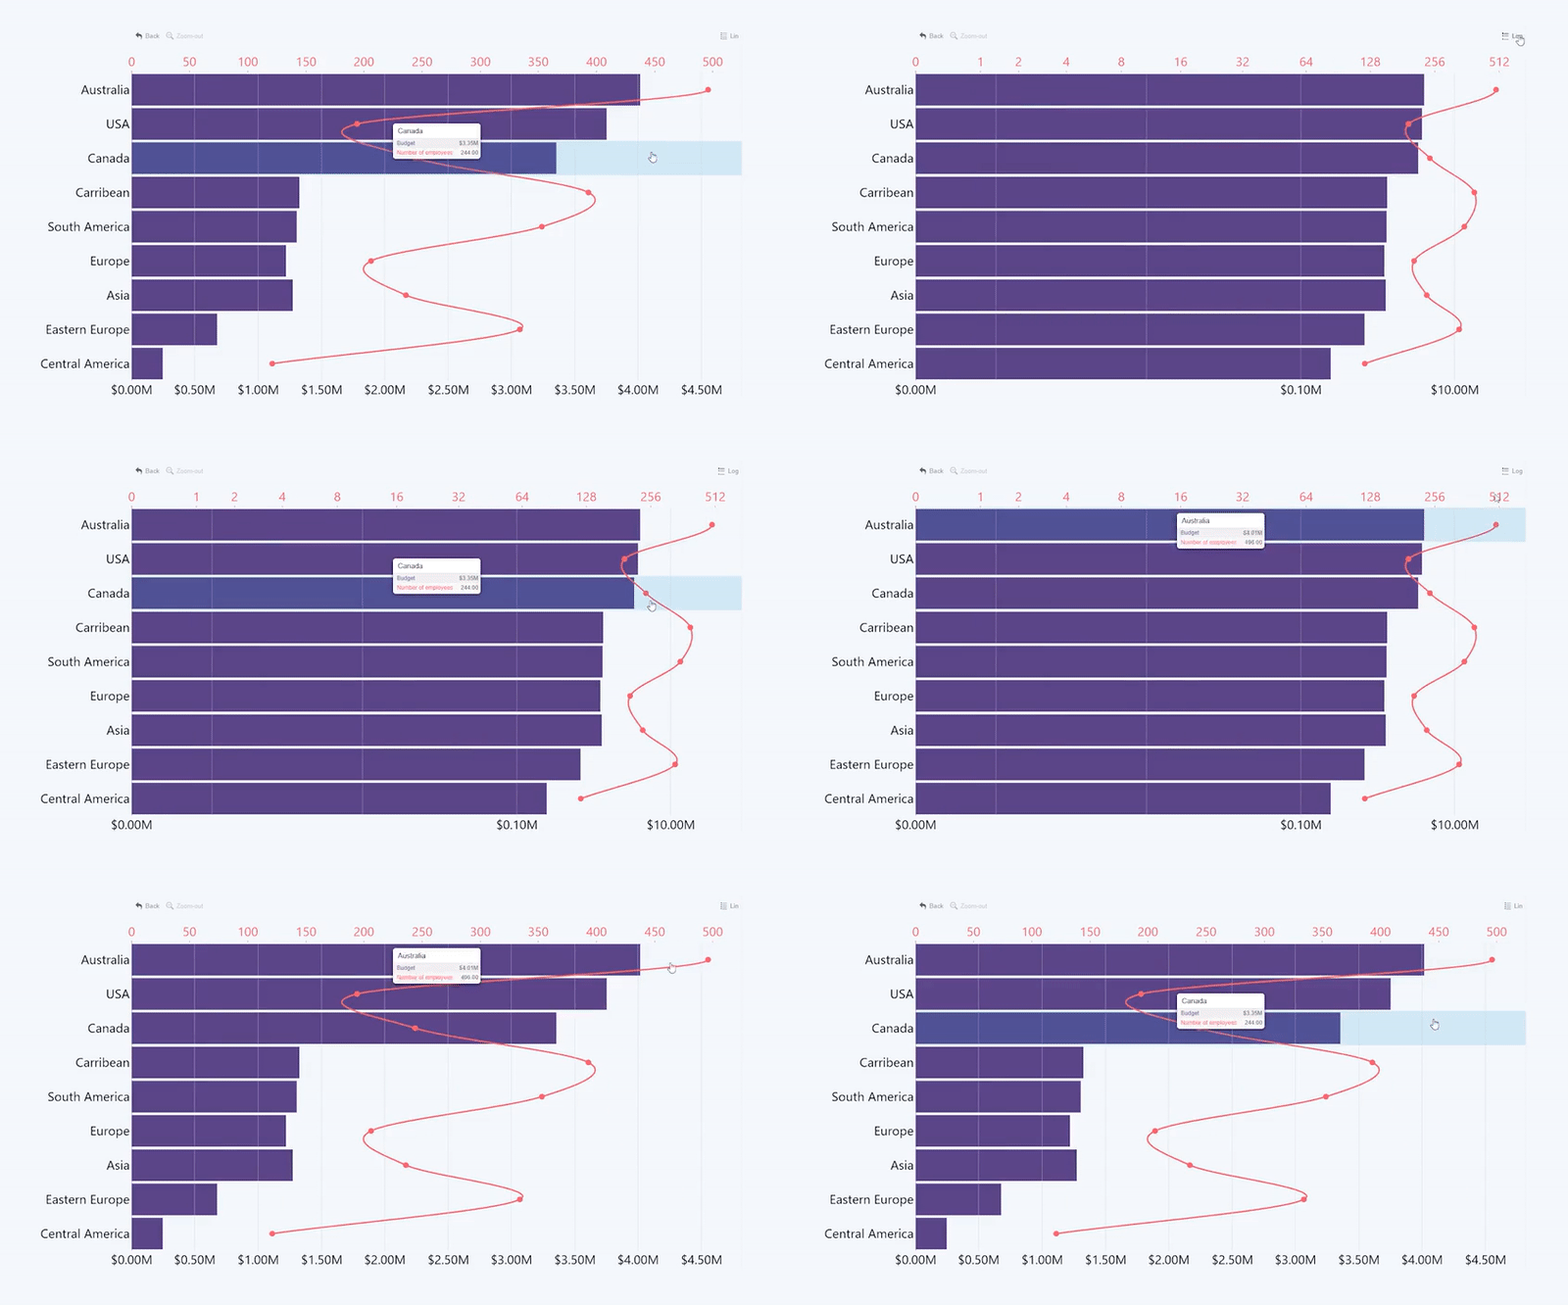
Change the X-Axis scale to display values on a linear or logarithmic scale by pressing the Lin/Log Scale button on the toolbar if it's enabled.
Make a selection
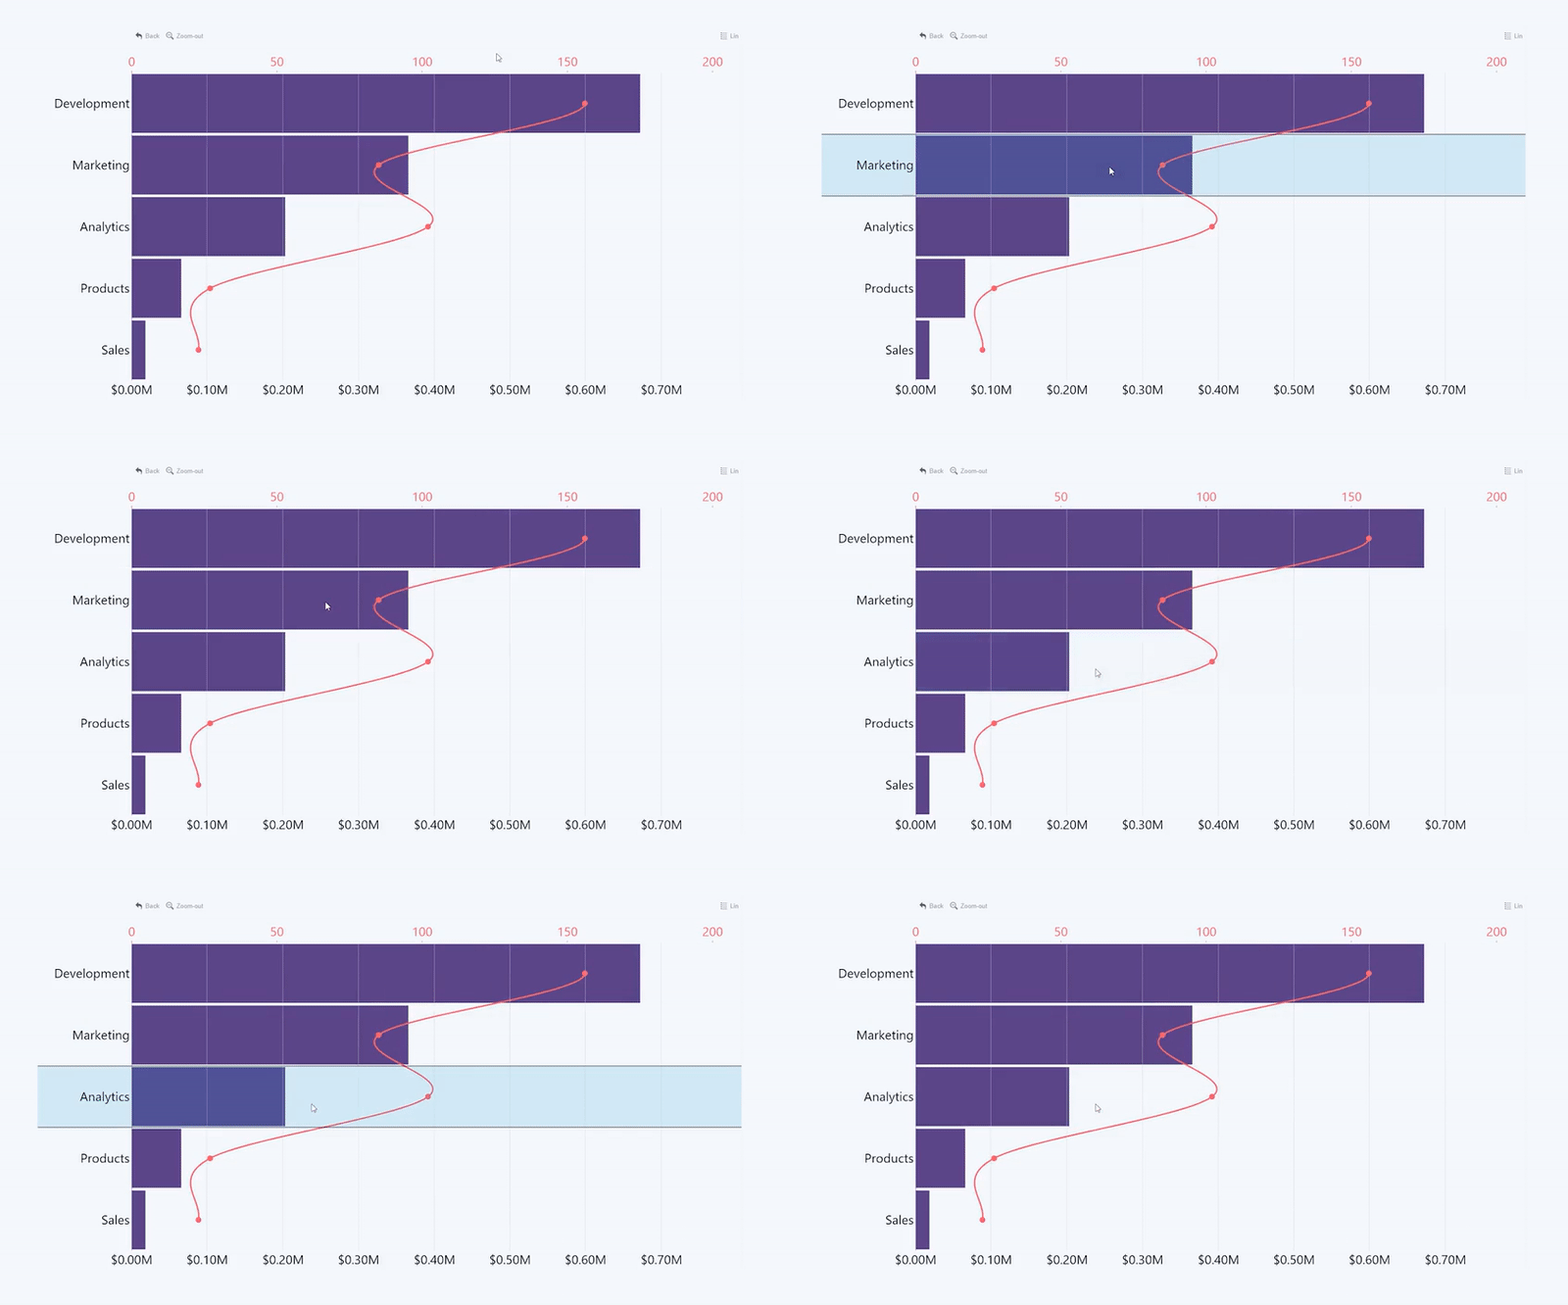
Clicking on a data point will make a selection only if you are at the last hierarchy level, otherwise it will drill down. To select a single data point at any level, hold left click.
Multiple Select
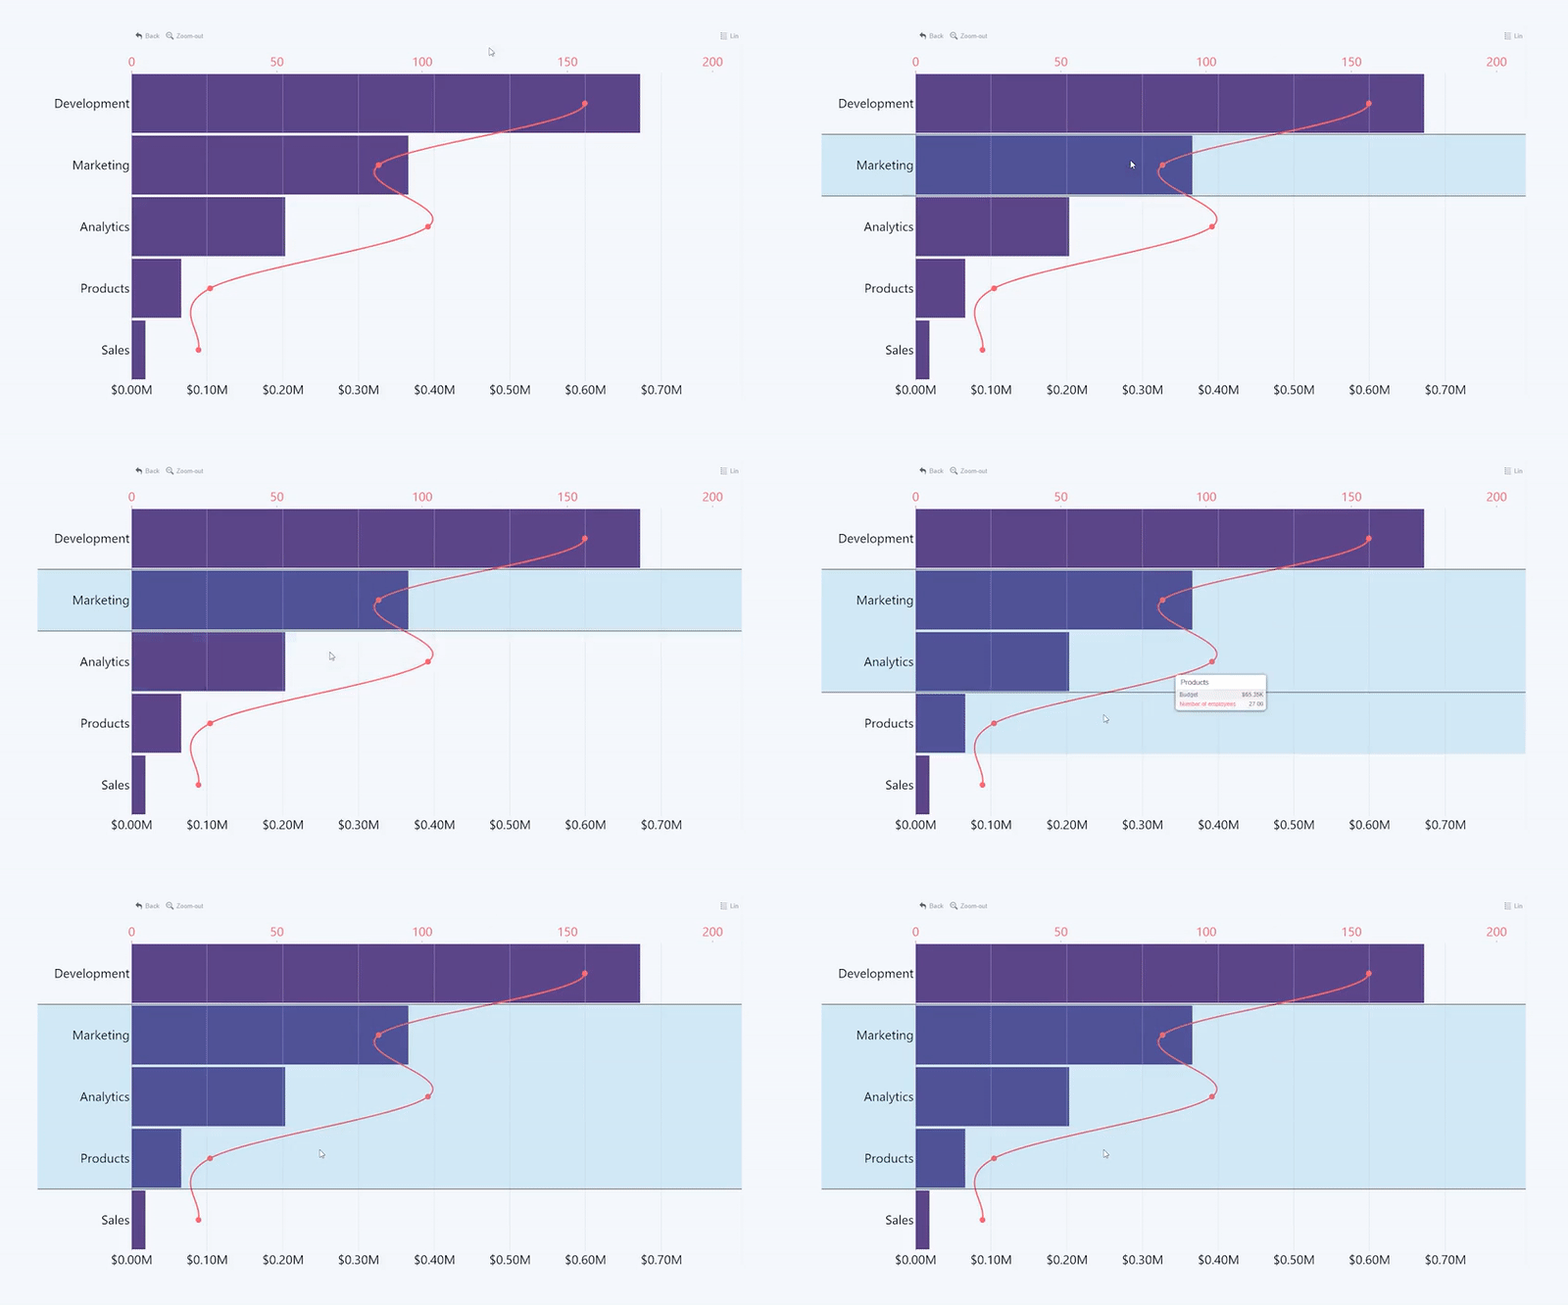
You can add more data points to an active selection by holding Shift or Ctrl while clicking. Click anywhere outside the selection area to clear the selection.
Invert Selection
Triple click on the chart to invert your selection. This interaction will deselect all categories that were previously selected and instead select all categories that were not selected.
Hide/Show series
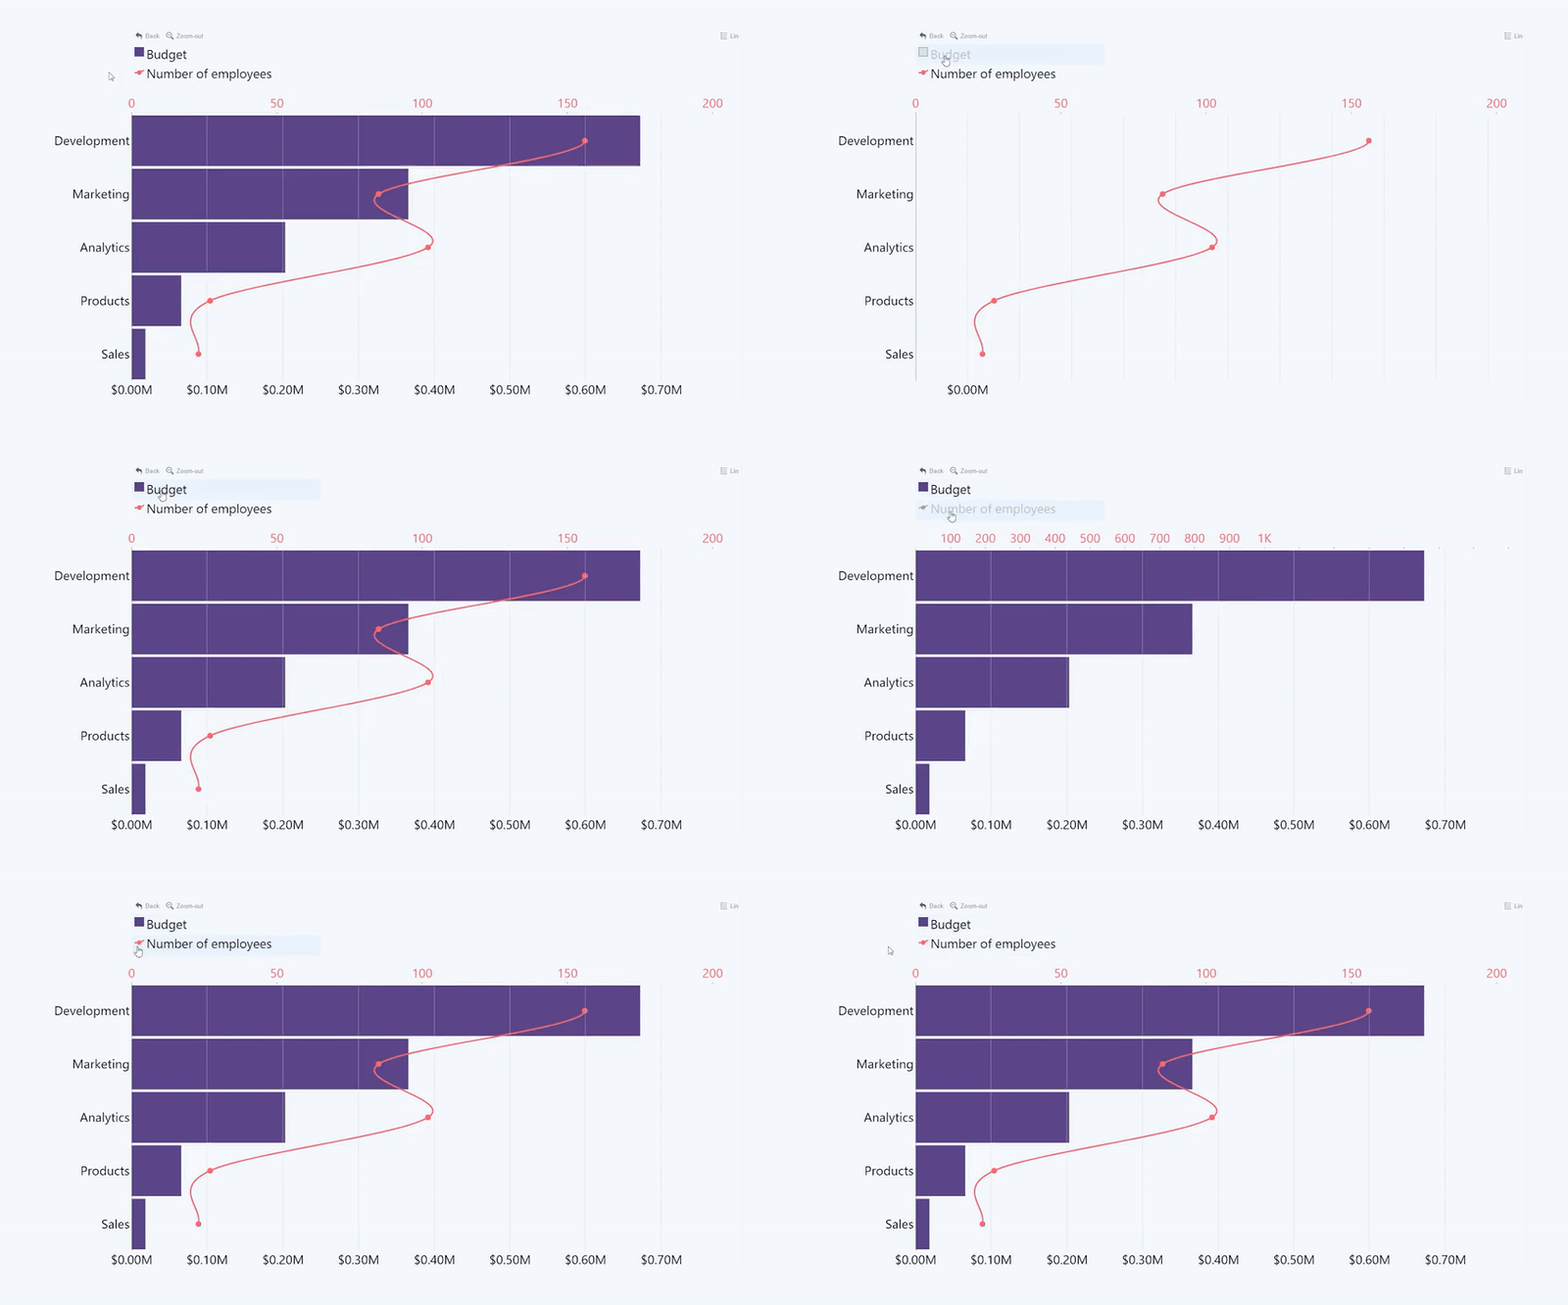
Click on a legend item (if the legend is enabled) to toggle visibility of a specific series.
Was this helpful? Thank you for your feedback!
Sorry about that.
How can we improve it?