Show Label
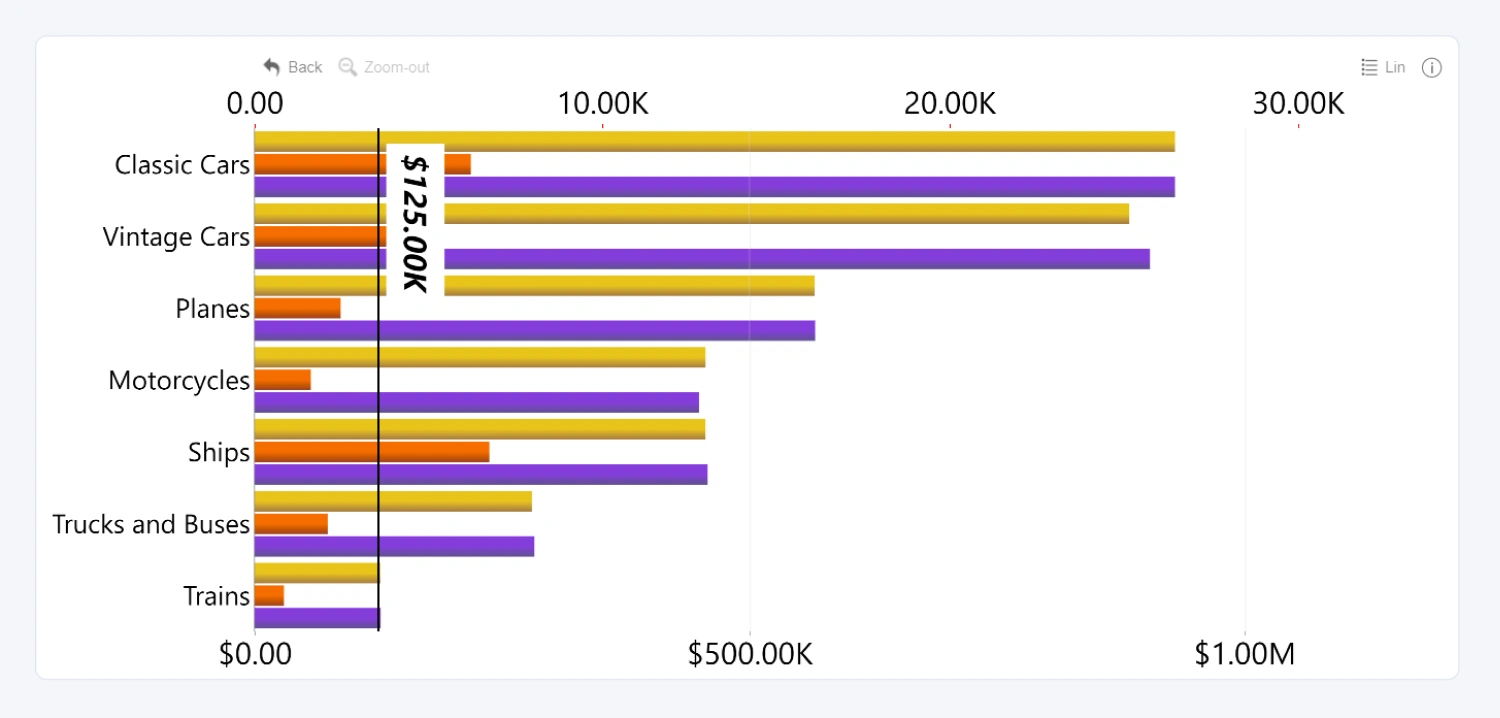
If this toggle is enabled, the threshold will display a label. You can use labels to provide a text description for the threshold (e.g., “KPI” or “Average”) and/or show the threshold’s value to the user.

Enabling this feature will reveal additional customization options for the label:
- Label Type: Choose what content is displayed in the label: Text, Value, or both.
- Label Text: Enter text you wish to display on the threshold label.
- Label Format: Exclusive to Change thresholds. Choose if the label displays the absolute difference between From and To values ('-525.5'), percentage difference ('-23%'), or both: '-525.5 (-23%)'
- Percentage Change Calculation: Exclusive to Change thresholds. Choose how the visual calculates the percentage difference between both values.
- Display Units: If the Label Type is Value or Text, Value, this setting controls the abbreviation for the value (for example, 500,000 -> 0.5M).
- Value Decimals: If the Label Type is Value or Text, Value, this setting can be used to limit the number of displayed decimals (for example, 5.2415321 -> 5.24).
- Font Size: Choose threshold font size between 8 and 60.
- Font Family: Choose font family by entering your desired font name from PBI default fonts (e.g. 'Segoe UI' or 'Times New Roman')
- Font Style: Choose between regular, bold, italic, bold and italic text style.
- Font Color: Choose your desired font color for the label text from the Power BI color picker menu.
- Background Color: Select the color for the threshold label's background (rectangular area behind the label text).
- Background Opacity: Adjust the background opacity between 0% (fully transparent) and 100% (fully opaque).
- Background Line Color: Choose the color for the background border - a line surrounding the rectangular area behind the label text.
- Background Line Opacity: Adjust the opacity of the border between 0% (fully transparent) and 100% (fully opaque).
- Background Line Width: Adjust the thickness of the background border between 1 and 10px, or enter 0 to make it invisible.
- Background Shadow Color: Choose the color that's used for the drop shadow effect of the label background.
- Background Shadow Color Opacity: Adjust the shadow's opacity between 0% (fully transparent) and 100% (fully opaque).
- Background Shadow Blur: Adjust the blur intensity for the drop shadow effect between 0 (no blur) and 10 (maximum blur).
- Label Horizontal Position: Choose if the threshold label is displayed on the left or right side of the chart.
- Label Vertical Position: Choose if the threshold label is displayed above, directly on, or below the threshold line.
- Label Horizontal Offset: Change the label's horizontal position by increasing its offset from the default position. 0 = default, 1 to 1000 = move towards the center of the chart, -1 to -1000 = move to the outside of the chart.
- Label Vertical Offset: Change the label's vertical position by increasing its offset from the default position. 0 = default, 1 to 1000 = move upwards, -1 to -1000 = move downwards.
- Label Border Radius: Adjust the 'rounded corner' effect for the label backgrounds with a value between 0 (none) and 20 (completely oval).
Was this helpful? Thank you for your feedback!
Sorry about that.
How can we improve it?