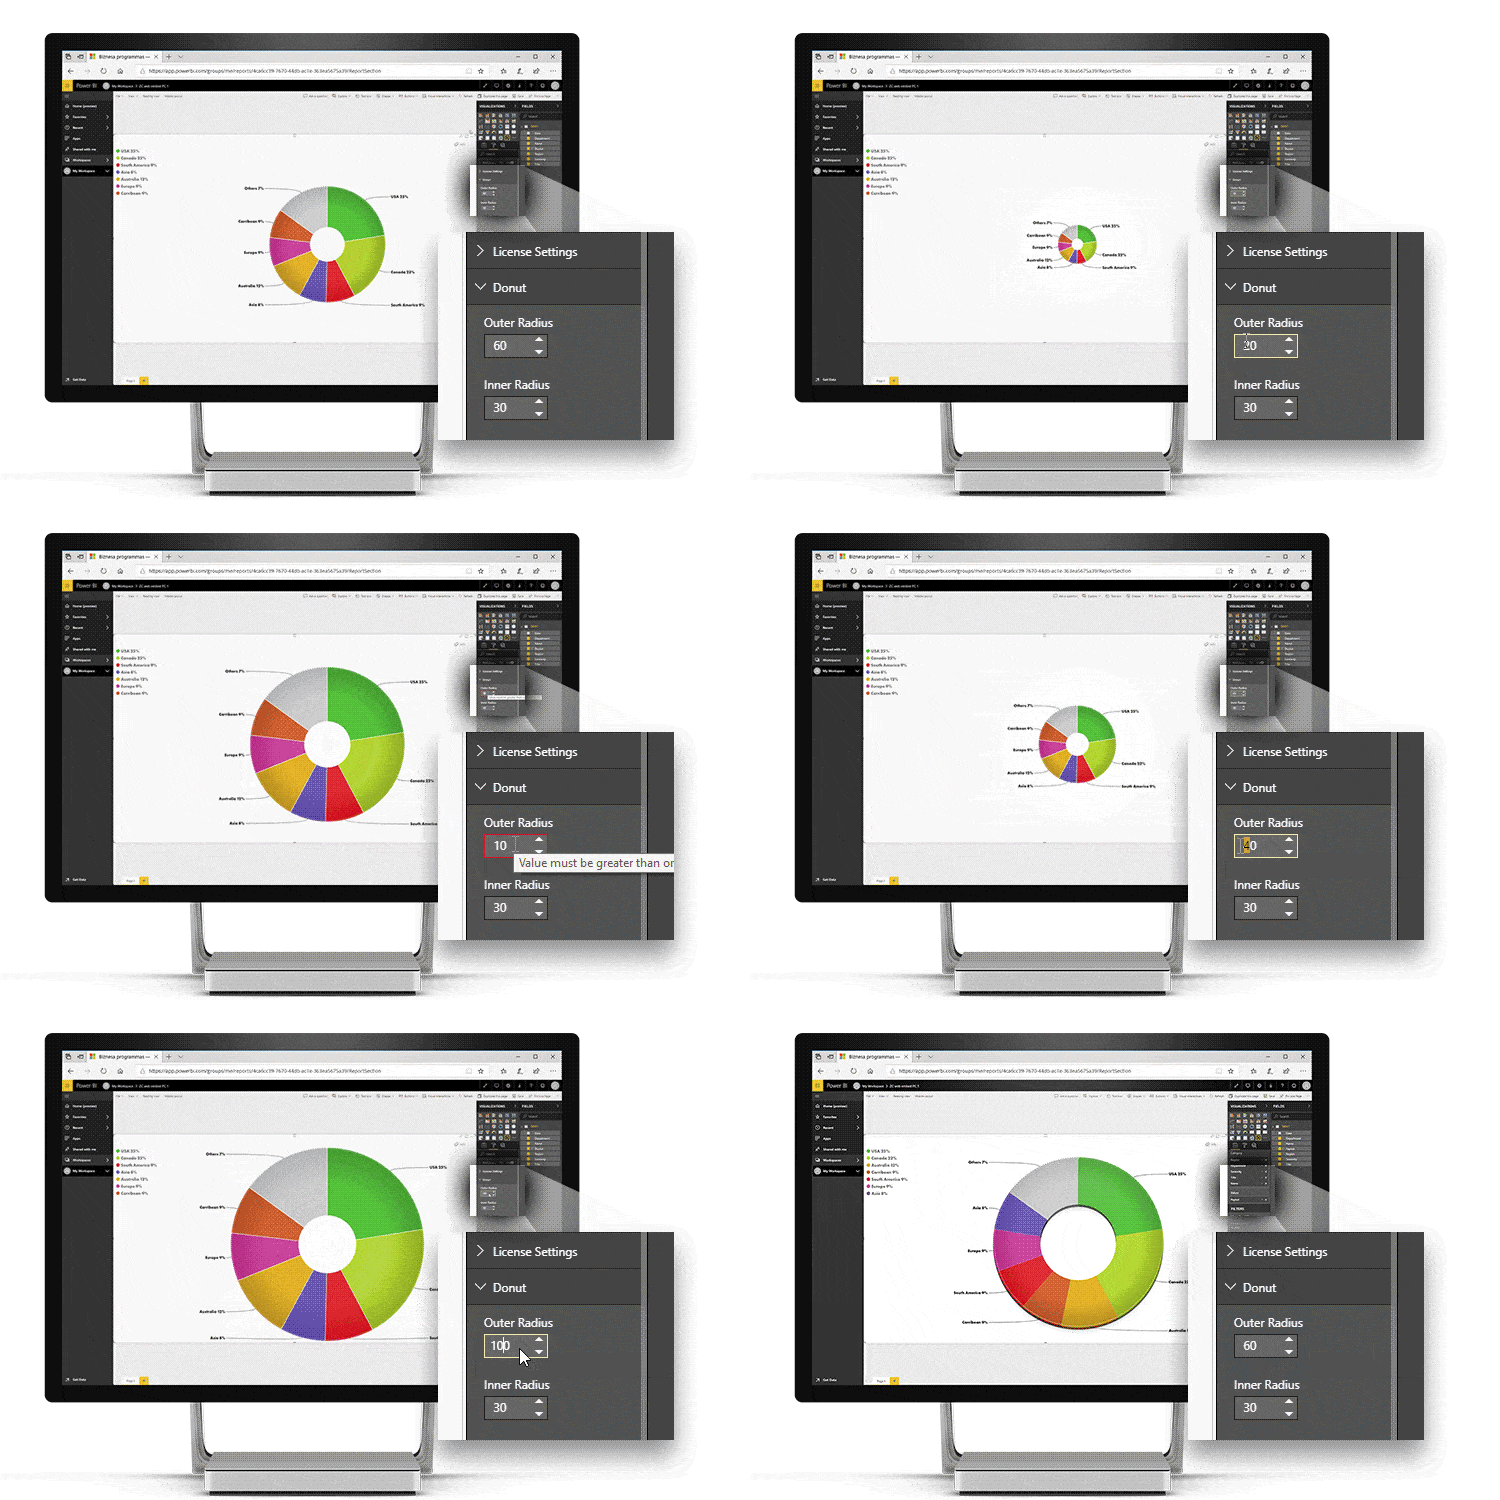
Outer Radius
This setting determines how much of the available visual container area is used to draw the donut chart. The default value is 60%, but you can use a custom percent value between 20 and 100.
Smaller radius values will reduce the donut radius and create more blank space, while higher values will create a larger donut chart within the available container.
Keep in mind that a large donut chart radius value may not leave enough space for Detail Labels (with Outside asLabel Placement) or Legend to be displayed properly.

Was this helpful? Thank you for your feedback!
Sorry about that.
How can we improve it?