23813
Power BI Used Car Sales Dashboard Template
Power BI Used Car Sales Dashboard Template
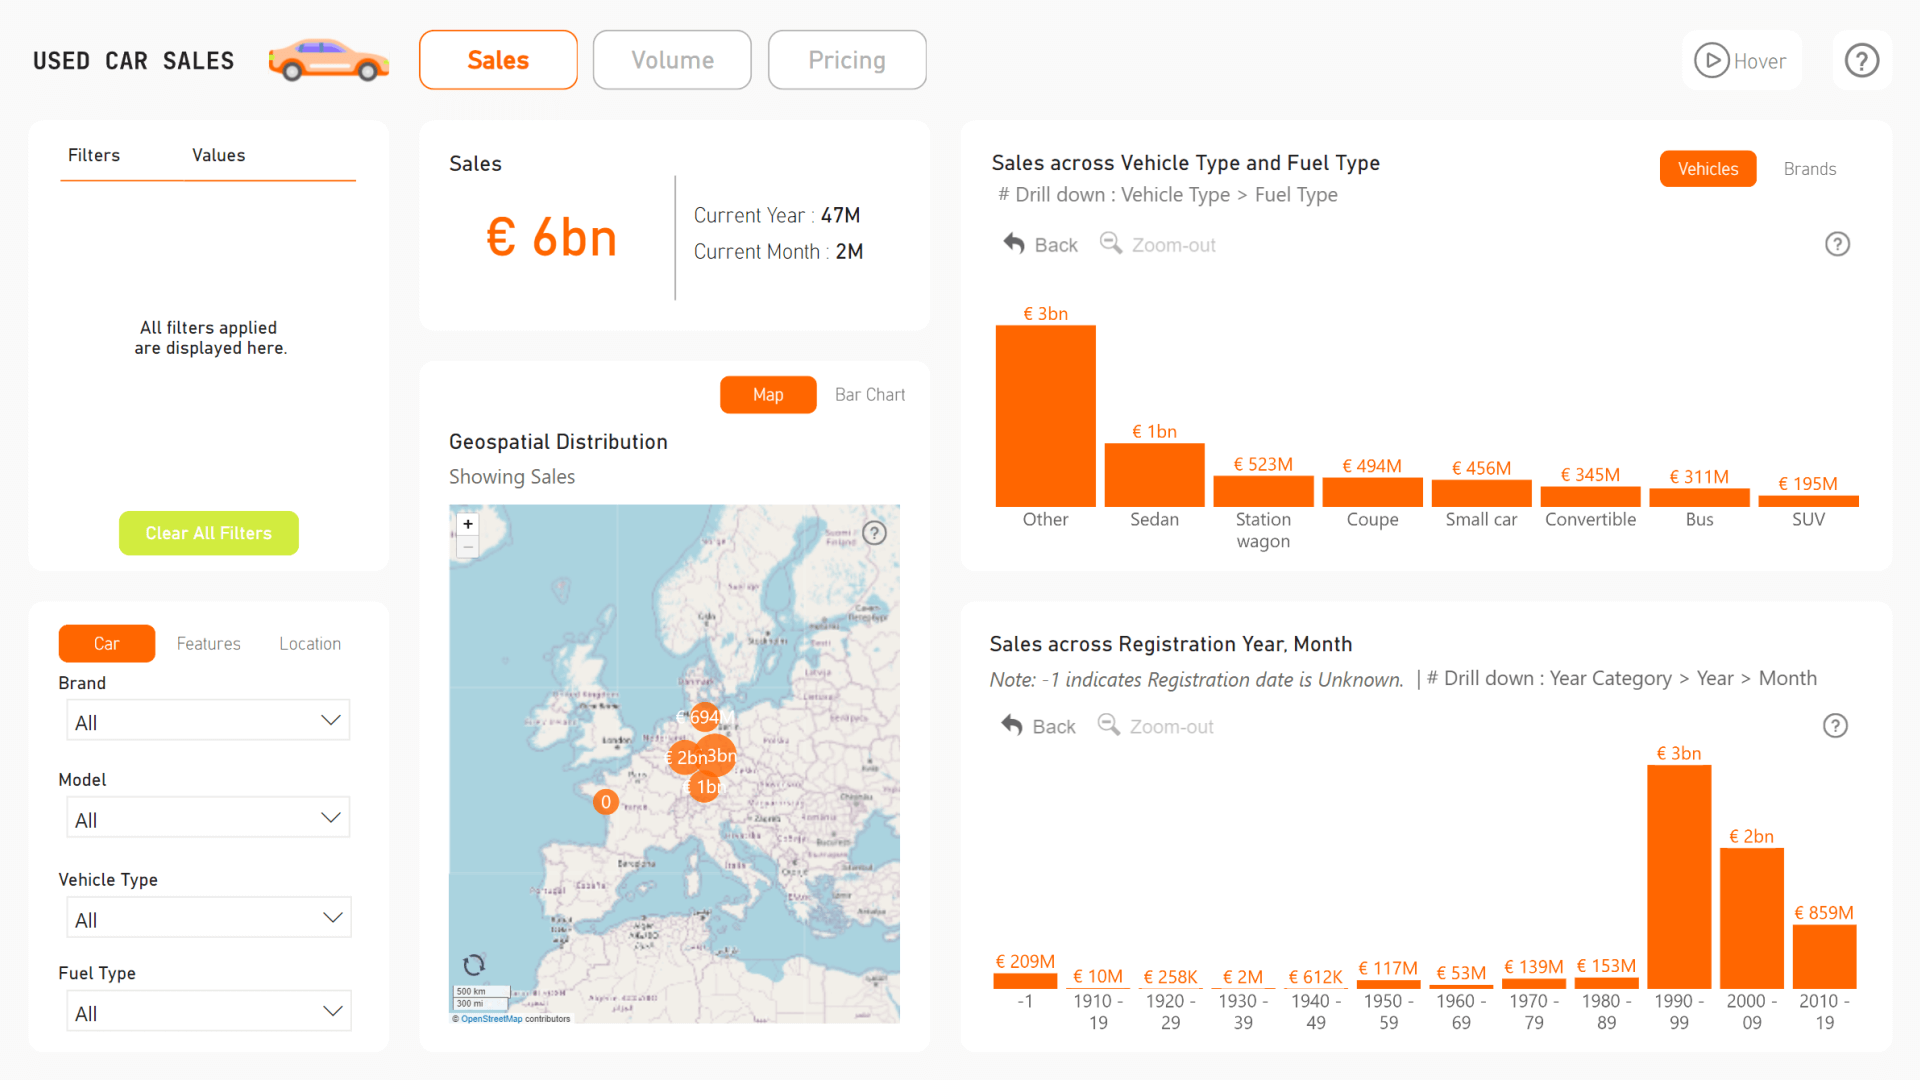
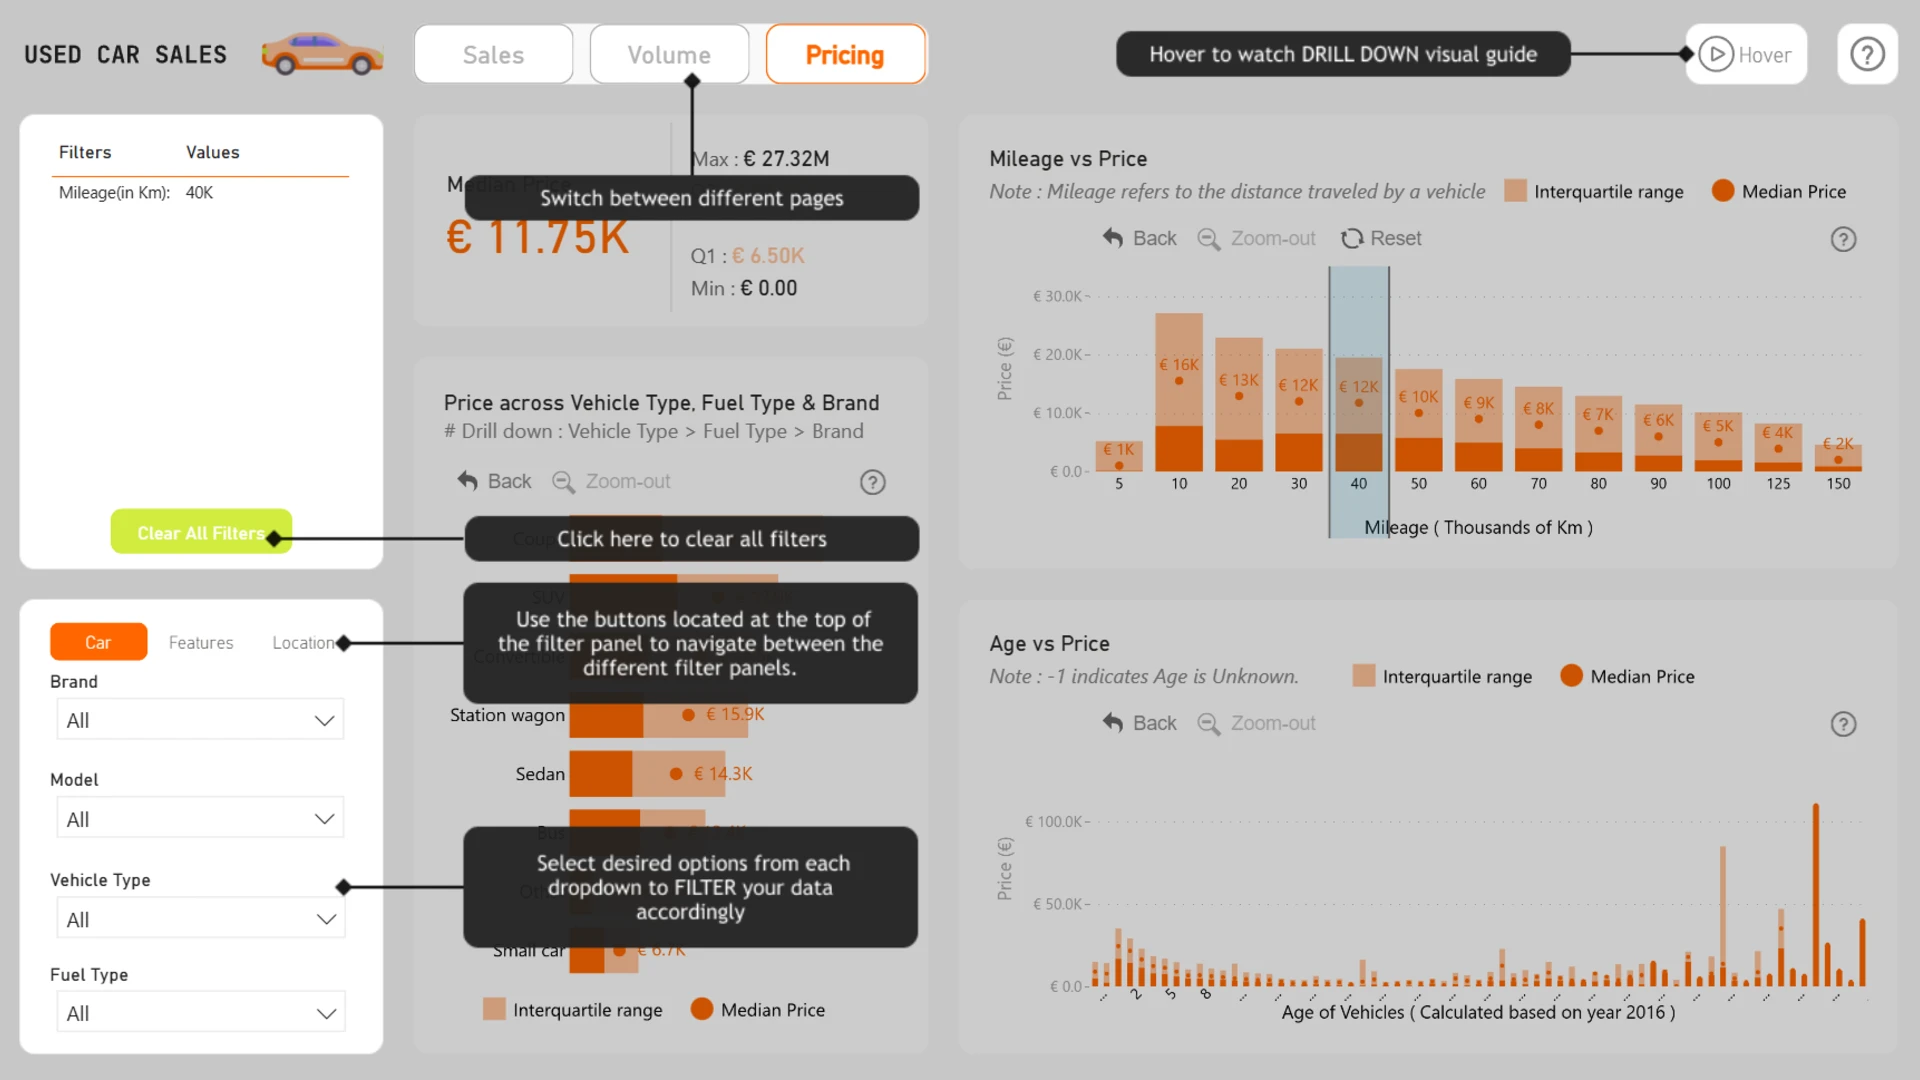
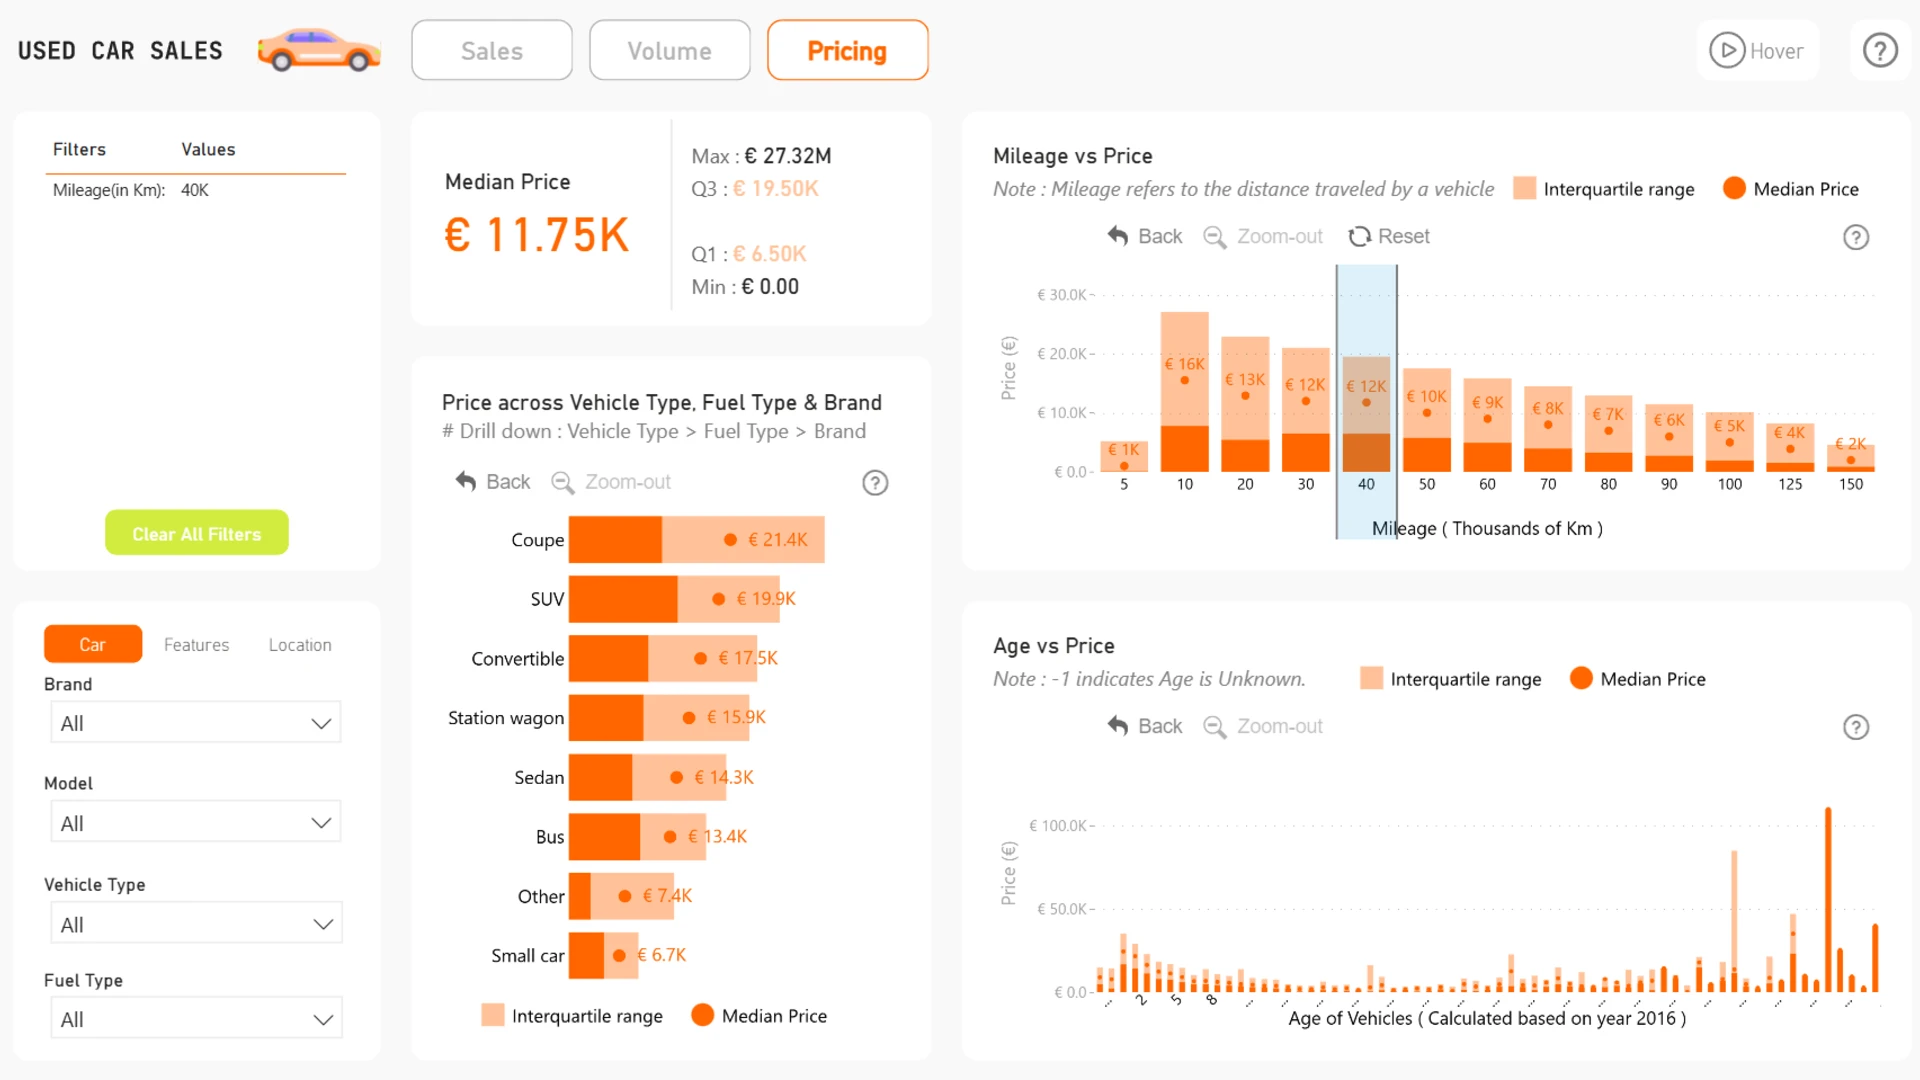
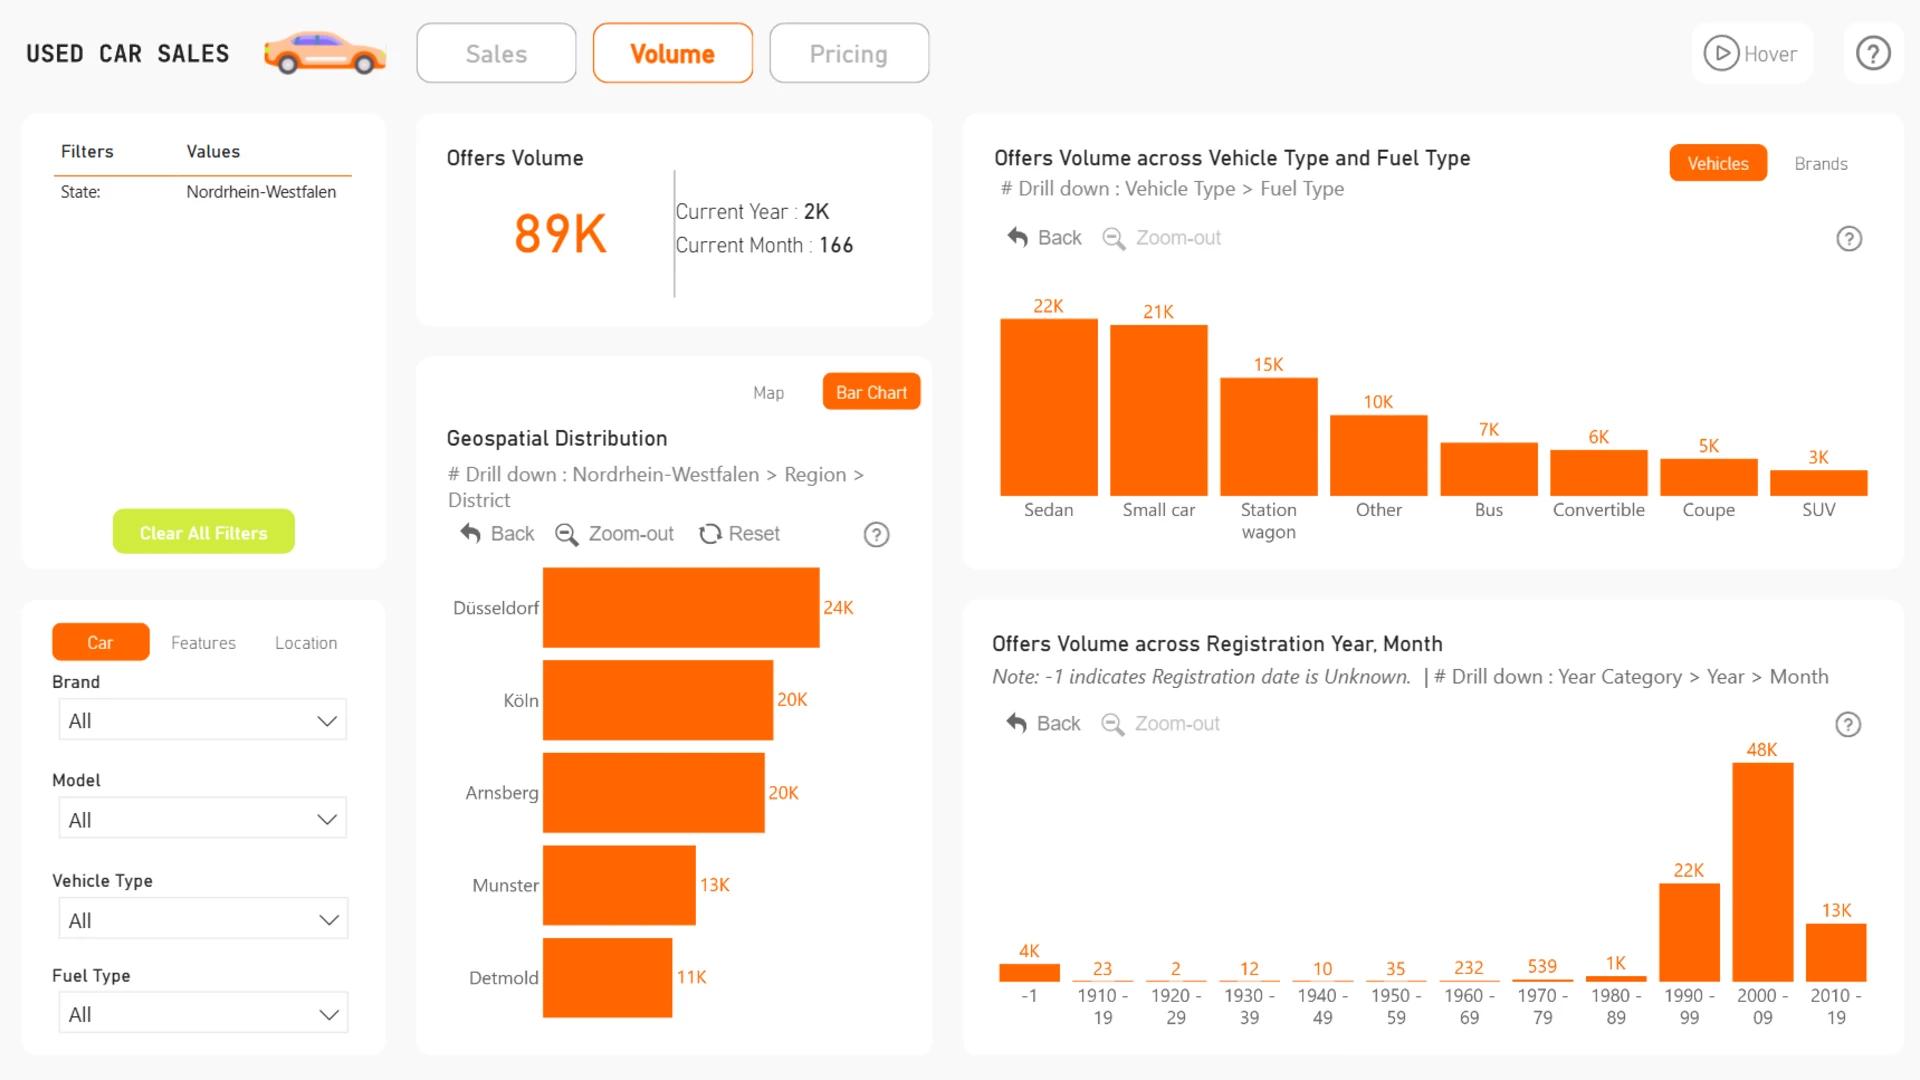
More Report pages
Report Author: Prathamesh Sawant
23813
Share template with others
Summary
Created by Prathamesh Sawant, this used car sales analytics dashboard is a Power BI example for exploring automotive sales data. It provides a practical reference for comparing vehicle sales performance and identifying patterns across the dimensions available in the dataset.
Key Insights of the Used Car Sales Analytics Dashboard
The dashboard organizes used car sales data into an interactive analytics experience. It provides a structure for exploring:
- Sales overview: a summary of the used vehicle sales information included in the dataset
- Vehicle comparisons: performance across the categories and attributes available in the dashboard
- Sales patterns: differences between the vehicle or sales segments represented in the data
- Automotive analytics: a practical Power BI approach to analyzing used car sales
Connected Power BI visuals make it easier to compare automotive sales data and examine performance from different perspectives.
How to Use This Used Car Sales Analytics Dashboard
Select active chart elements or filters to narrow the sales data. Compare the resulting views to investigate performance across the vehicle categories included in the dashboard.
Download the .pbix file to examine the dashboard structure, calculations, and visual configuration. Open it in Power BI Desktop and customize the analysis for your own automotive sales data.



4U Report Challenges
Participate in data challenges, build and submit reports to get free template downloads.
Join CommunityMobile view allows you to interact with the report. To Download the template please switch to desktop view.
How to use a PBIX template
Preview the interactive report, download the PBIX file, open it in Power BI Desktop, and replace the same data connection with your own dataset.
Preview and download
Explore the report online and download the PBIX template file.
Open in Power BI Desktop
Open the downloaded PBIX file in Power BI Desktop.
Connect your data
Replace the sample data source with your own dataset.
Refresh and adjust
Refresh the model and update fields or visual were needed.
Save and share
Save your report and publish it for your audience.


