23166
Spotify Top Artists & Trends Report by Frida Daniel
Spotify Top Artists & Trends Report by Frida Daniel
Report Author: Frida Daniel
23166
Share template with others
Summary
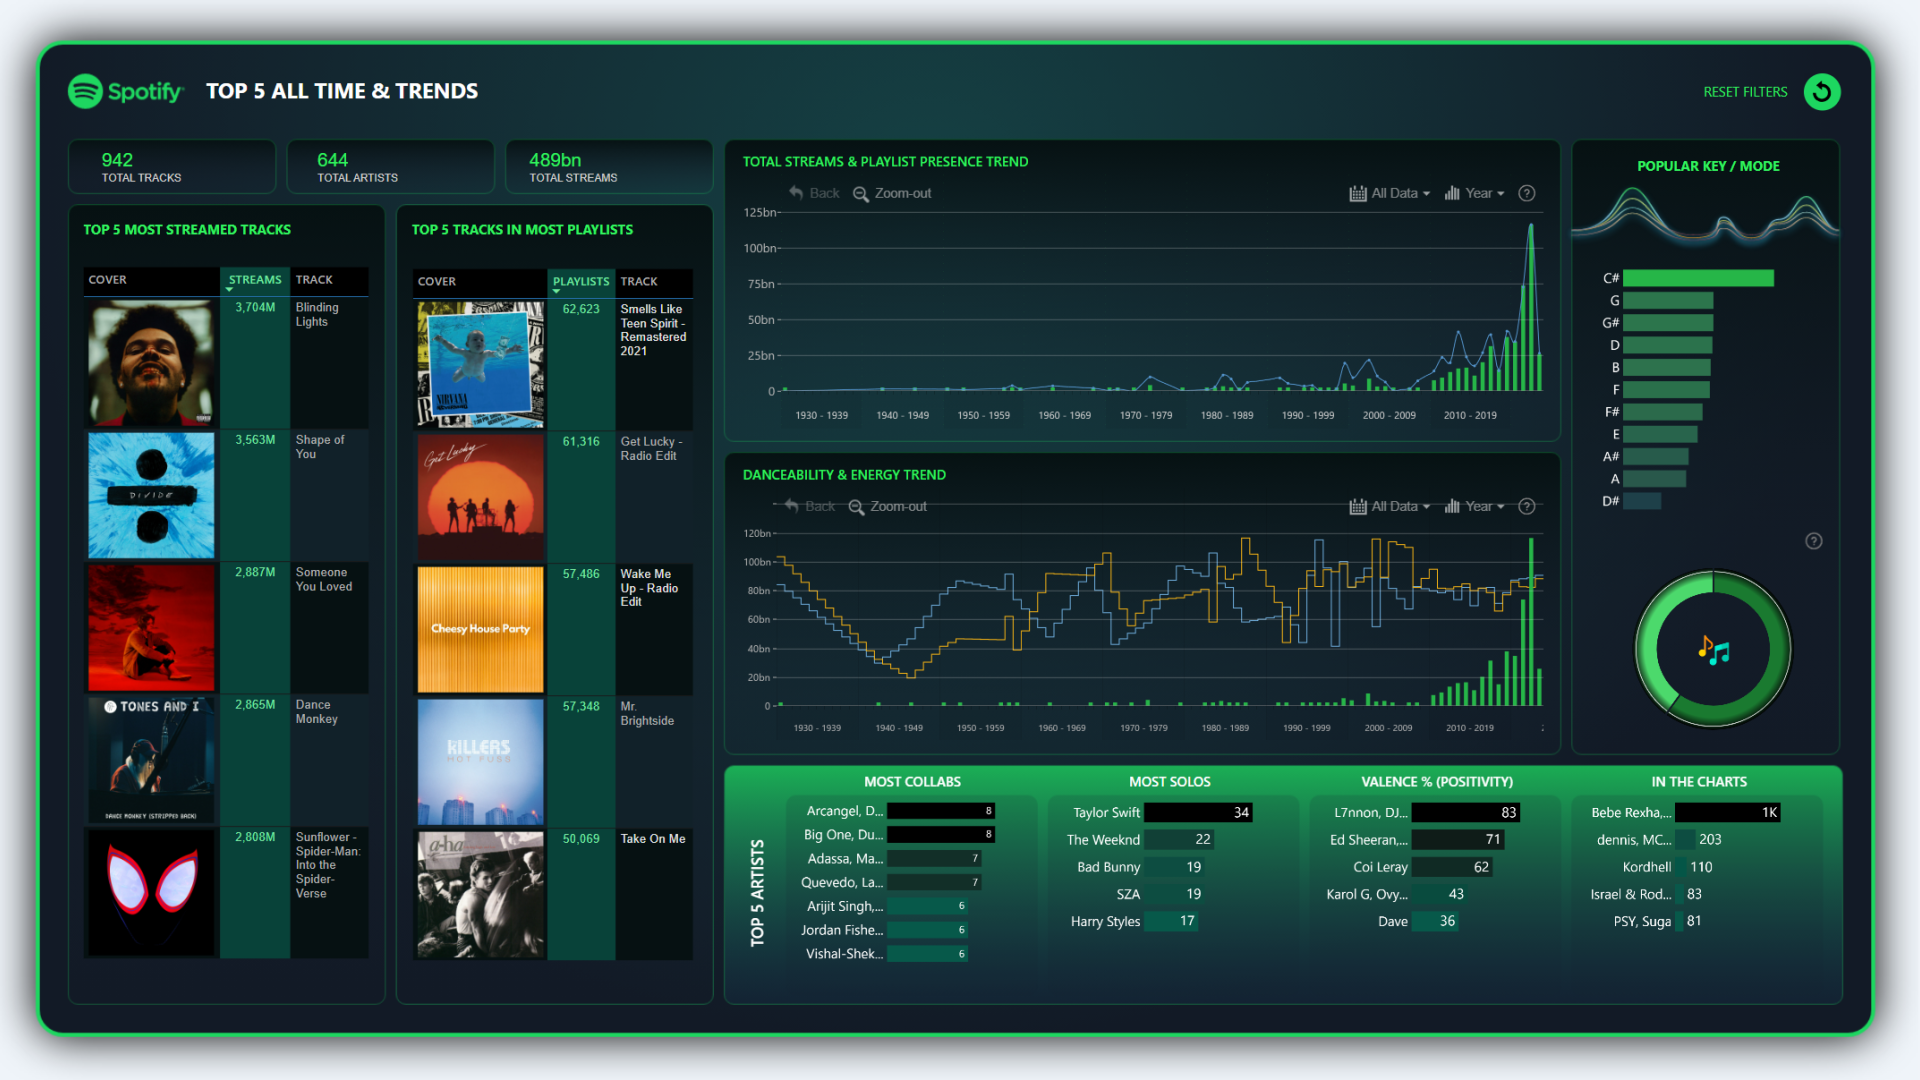
This Power BI report is based on the winning entry for ZoomCharts Mini Challenge which was hosted as a part of the October 2023 DataDNA Dataset Challenge, hosted by Onyx Data. The challenge dataset was based on music streaming metrics by Spotify.
The report places a visual emphasis on the most listened artists and songs, supplementing it with insights on relation between music popularity and release date on a timeline chart, in addition to data about the most popular song keys, danceability, and other metrics.
The original contest submission can be viewed here. ZoomCharts team has performed minor adjustments and visual refinements, and replaced the bar chart visuals with Drill Down Combo Bar PRO.
How To Use This Report Template
To interact with this Power BI report, simply click any active elements directly on the charts.
Download this report to see all the settings, formulas, and calculations. Try it out with your own data by making a few adjustments.
4U Report Challenges
Participate in data challenges, build and submit reports to get free template downloads.
Join CommunityMobile view allows you to interact with the report. To Download the template please switch to desktop view.

Was this helpful? Thank you for your feedback!
Sorry about that.
How can we improve it?