12556
Shark Tank Analysis by Dharmendar S
Shark Tank Analysis by Dharmendar S
Report Author: Dharmendar S
12556
Share template with others
Summary
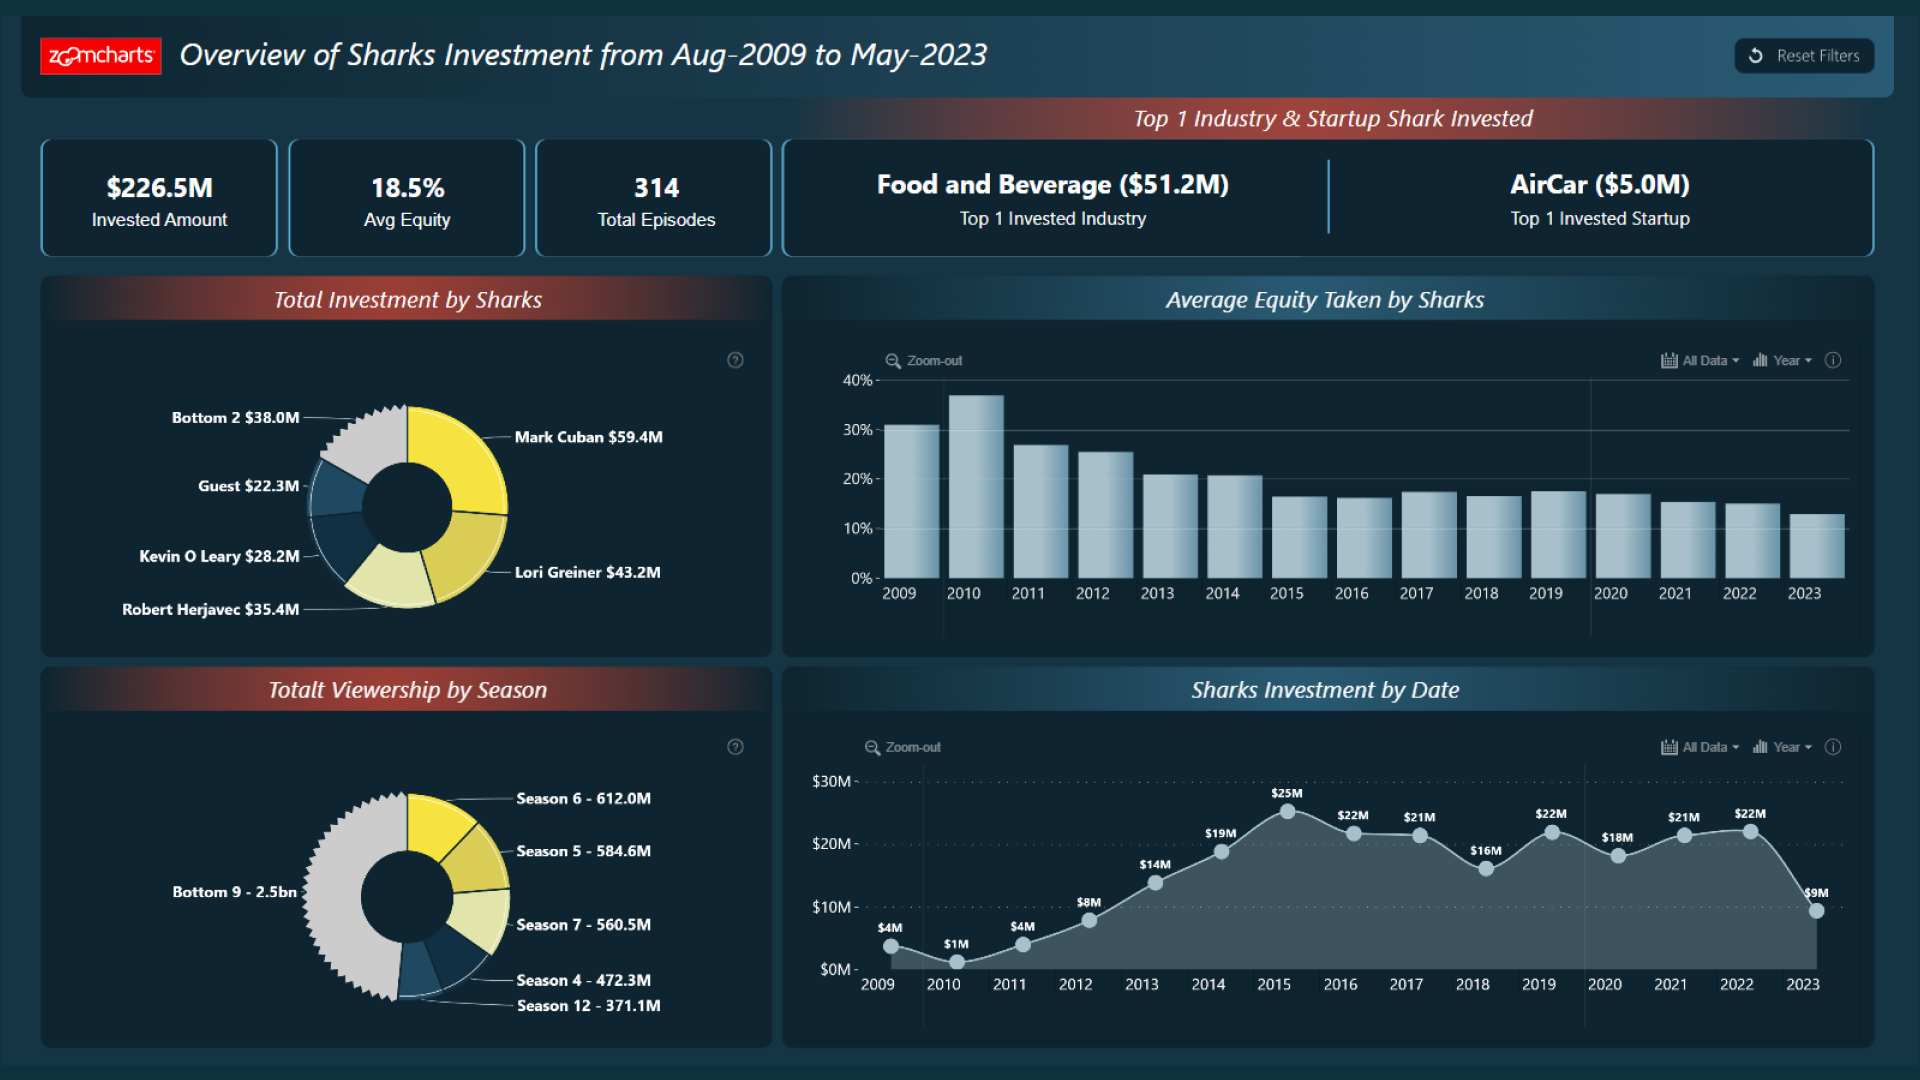
This Power BI report is based on the winning entry for ZoomCharts Mini Challenge, September 2023, which was hosted in collaboration with Onyx Data. The challenge dataset was based on the popular TV show Shark Tank US.
The report has been reviewed by ZoomCharts team and enhanced with ZoomCharts custom Drill Down PRO visuals to showcase the ease of use and features such as on-chart interactions and cross-chart filtering, resulting in a more user-friendly experience.
See the original report submitted by the author here.
How To Use This Report Template
To interact with this Power BI report, simply click any active elements directly on the charts.
Download this report to see all the settings, formulas, and calculations. Try it out with your own data by making a few adjustments.
4U Report Challenges
Participate in data challenges, build and submit reports to get free template downloads.
Join CommunityMobile view allows you to interact with the report. To Download the template please switch to desktop view.


Was this helpful? Thank you for your feedback!
Sorry about that.
How can we improve it?