logo
For Power BI Report Templates
  • Products

    Drill Down Visuals for Power BI

    Discover the most customizable custom visuals for Power BI.

    Pricing & licensing
    • Drill Down Donut Pro
      Drill Down Donut Category Composition
    • Drill Down Pie Pro
      Drill Down Pie Proportional Breakdown
    • Drill Down Combo Pro
      Drill Down Combo Multi-Metric Trends
    • Drill Down Combo Bar Pro
      Drill Down Combo Bar Cross-Metric Trends
    • Drill Down Line Pro
      Drill Down Line Trend Analysis
    • Drill Down Bubble Pro
      Drill Down Bubble Value Relationships
    • Drill Down Scatter Pro
      Drill Down Scatter Correlation Analysis
    • Drill Down Network Pro
      Drill Down Network Entity Connections
    • Drill Down Graph Pro
      Drill Down Graph Relationship Mapping
    • Drill Down Map Pro
      Drill Down Map Geographic Insights
    • Drill Down Waterfall Pro
      Drill Down Waterfall Change Breakdown
    • Drill Down Timeline Pro
      Drill Down Timeline Time-Based Metrics
    • Drill Down TimeSeries Pro
      Drill Down TimeSeries Temporal Patterns
    • Drill Down Line Pro
      Drill Down Line Trend Analysis

    Visuals in Planning

    Discover visuals we’re exploring, share your feedback, and help us decide what to build next.

    Browse concepts
  • Template Reports
    • Browse Report Templates
      Browse Report Templates Explore 2000+
      Power BI reports
    • Pricing Report Templates
      unlimited access

    Explore Report Templates

    Industry

    • Logistics
    • Education
    • Healthcare
    • Transportation
    • Banking
    • Ecommerce
    • Crime analytics
    • Retail
    • Manufacturing

    Business Domain

    • Sales
    • Marketing
    • Accounting & Finance
    • Human Resources
    • Research
    • Project Management
    • CRM
    • Support
    • Customer experience
  • Resources

      Learn

    • Video Tutorials Step-by-step Power BI guides
    • Webinars Live and recorded expert sessions
    • Visuals Gallery Explore all custom Power BI visuals
    • Blog Power BI tips, updates, and guides
    • Documentation Setup, features, and API reference

    Support

    • ZoomCharts Assistance Help from our product experts
    • Contact Sales Questions about pricing or licensing
    • Contact Support Technical help and troubleshooting
    • FAQ Quick answers to common questions
  • Services
    • Power BI Report Development
      Power BI Report Development End-to-end custom
      Power BI reports.
    • Custom Visual Development
      Custom Visual Development Custom visuals for
      your business needs.
  • Challenges
  • Pricing
Get started
Get started
Get it now
Go back

Contents

Dashboard and report examples School Analytics Power BI Report by Norman Reynaldo Sabillon Castro
Go back

43061

School Analytics Power BI Report by Norman Reynaldo Sabillon Castro

School Analytics Power BI Report by Norman Reynaldo Sabillon Castro

Report
Report

More Report pages

Report
Report
Report
Report
Report Interact

Overhauled by ZoomCharts

43061

Combo Combo Bar Donut Education

Share template with others

Summary

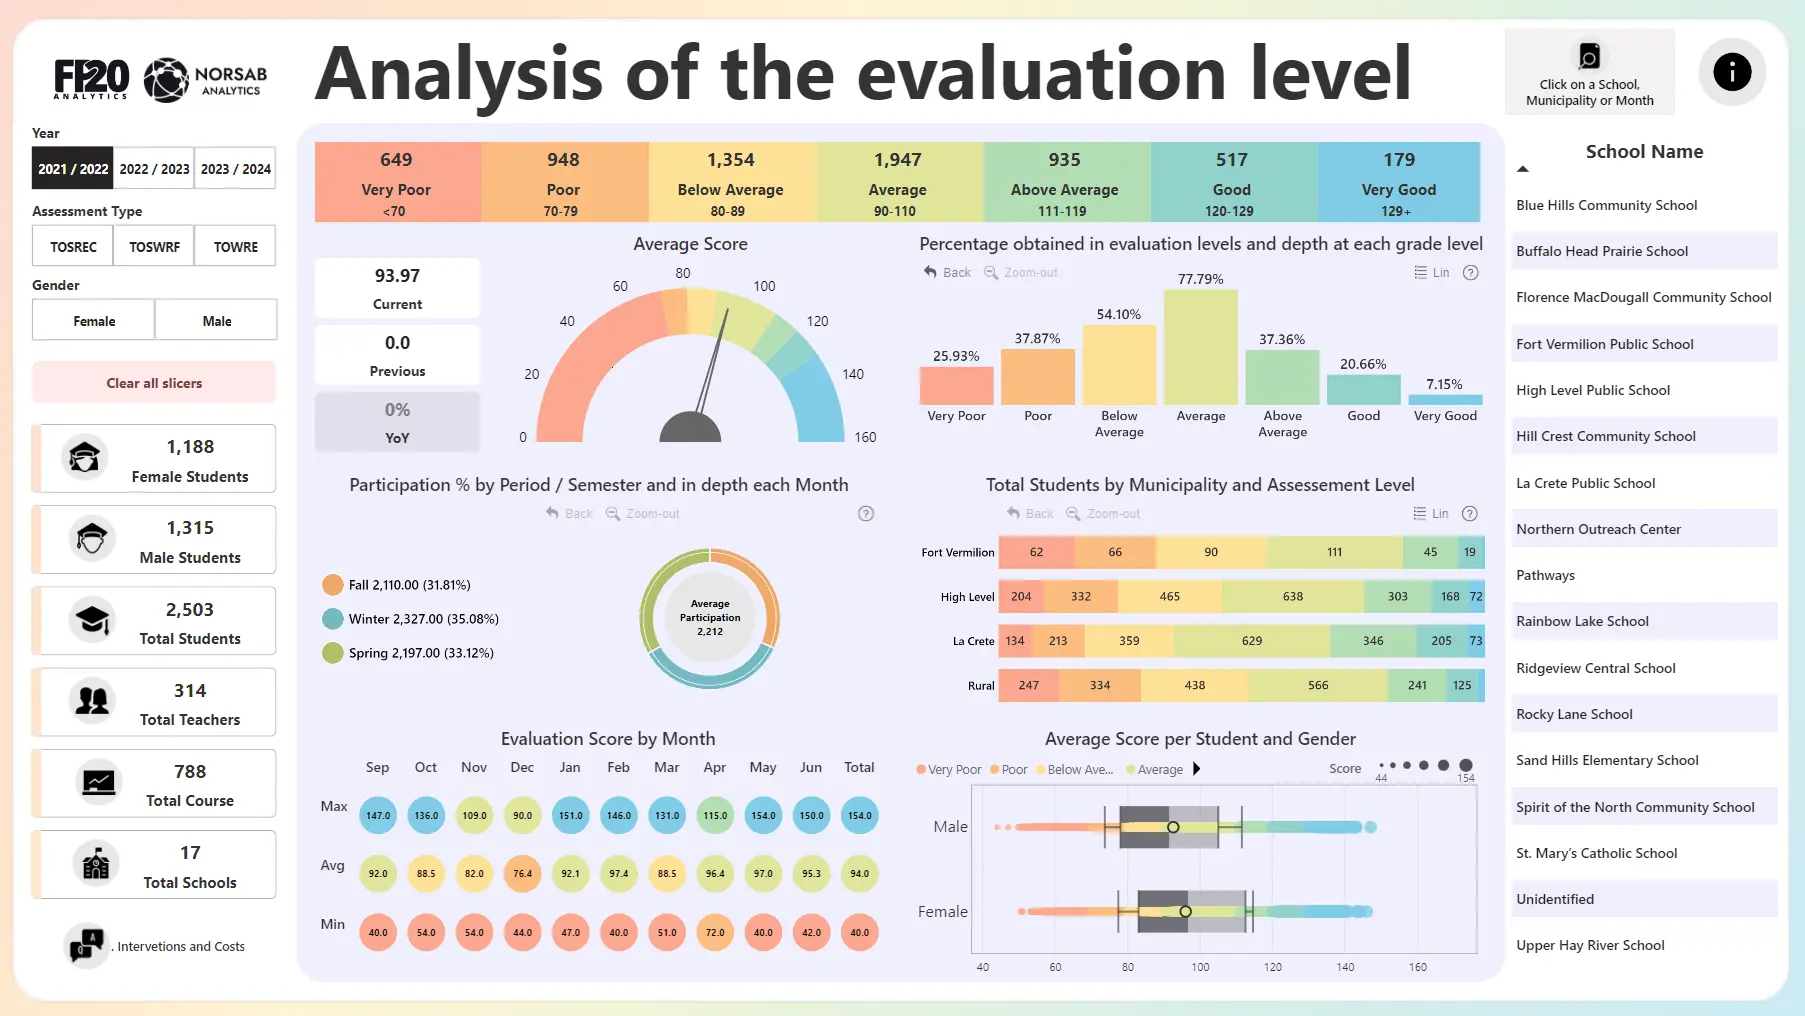
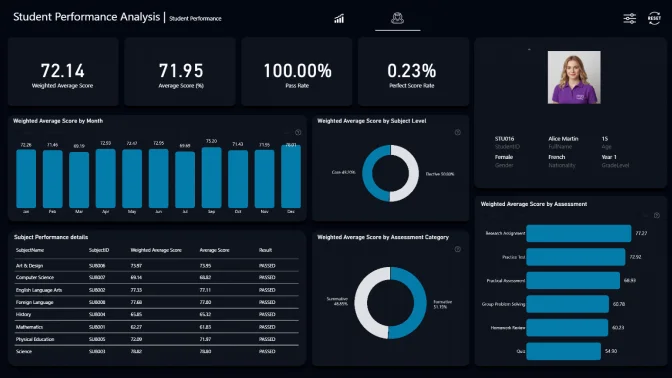
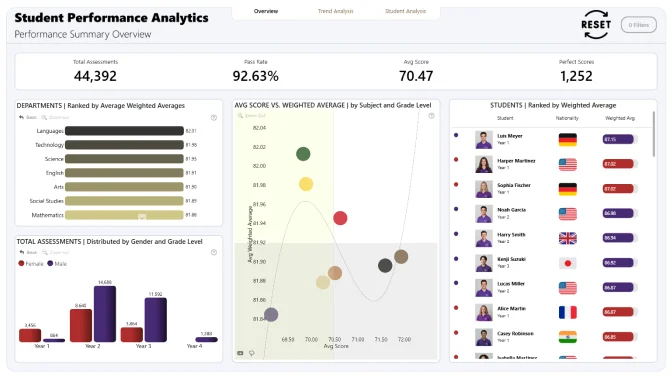
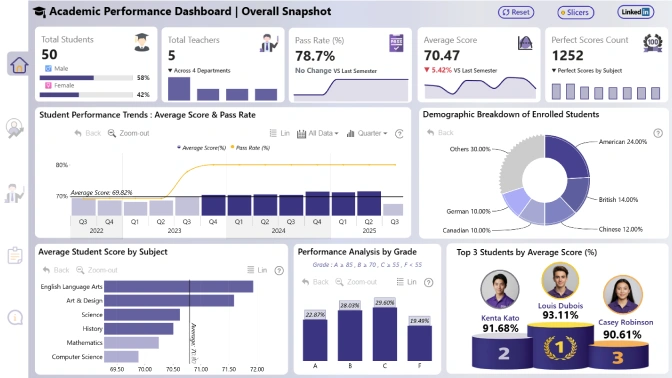
This report is the winning entry for the FP20 Analytics January 2024 ZoomCharts Challenge, which explored ways to use Power BI for schools. The contestant visualized the academic performance of students to see the overall evaluation level and trends over time, and identify students, classes or schools that need attention or additional resources.

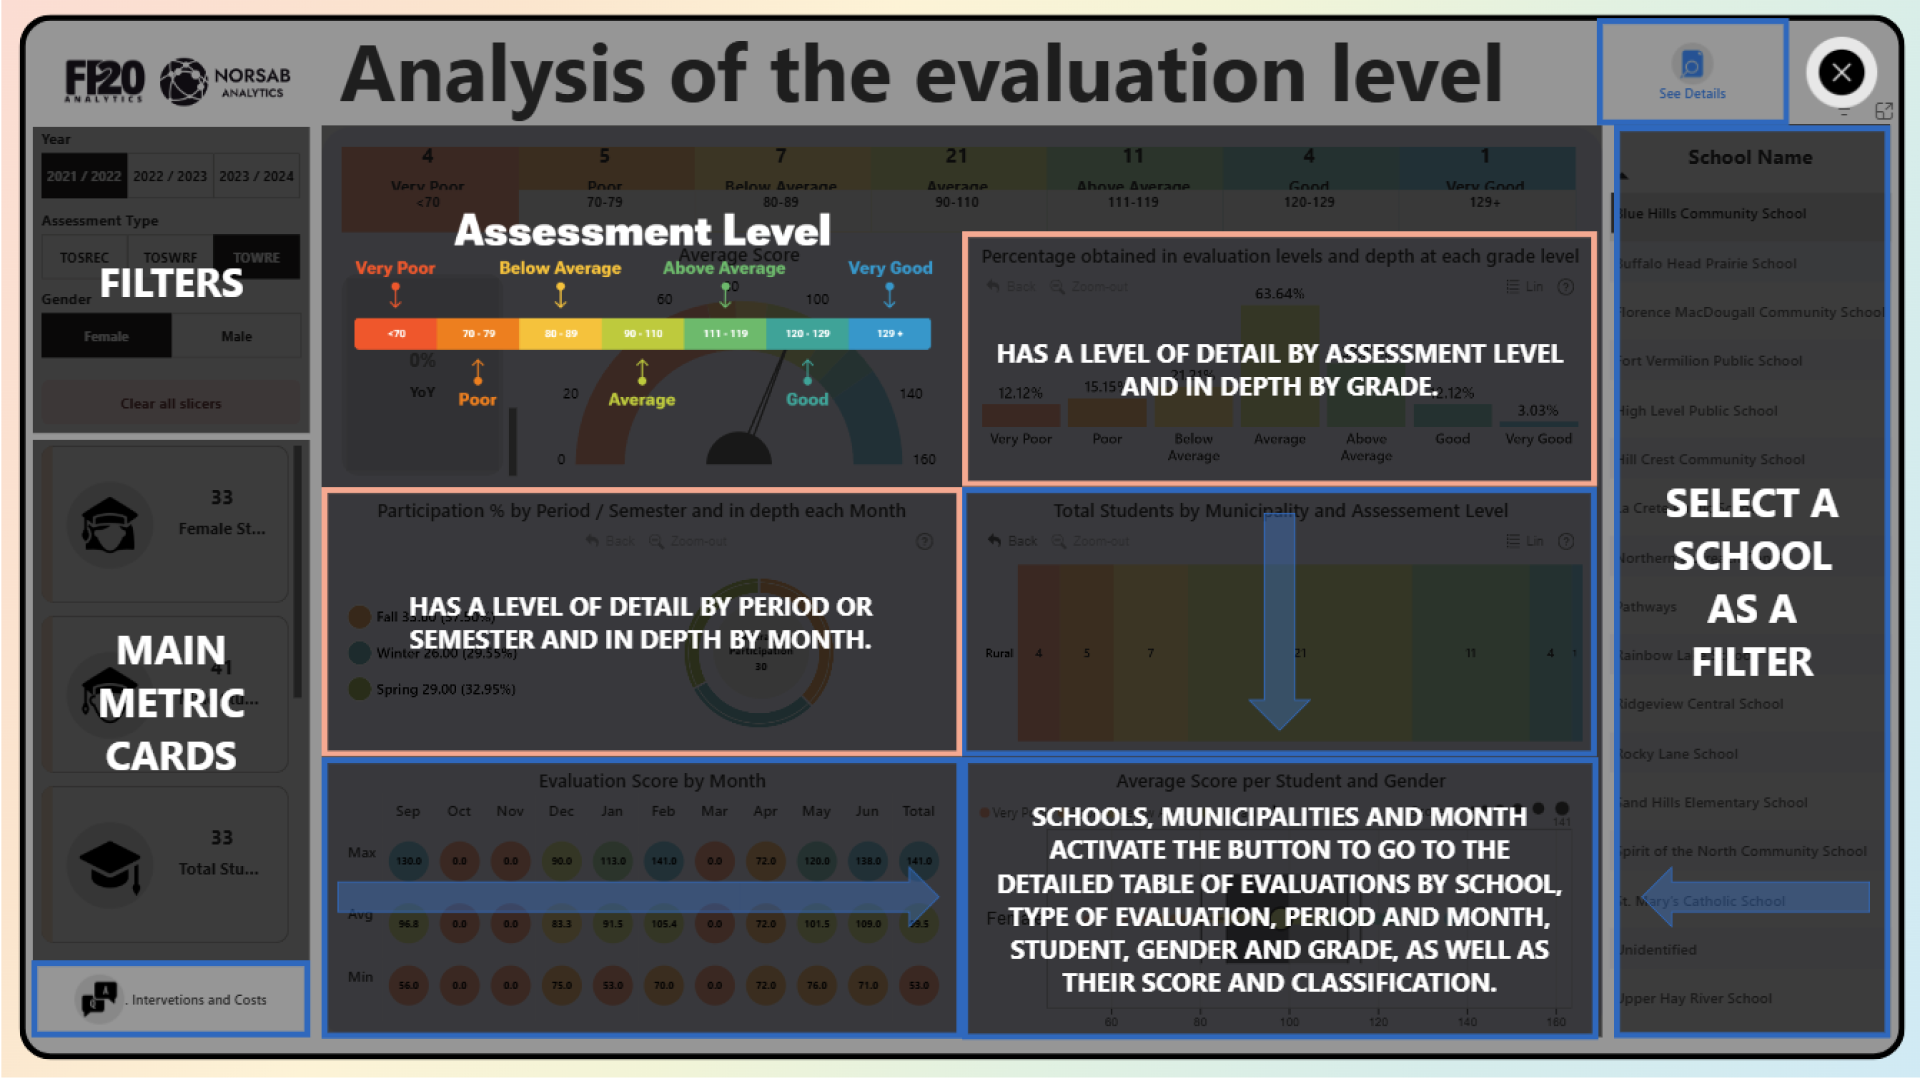
This school analytics Power BI report provides an all-encompassing overview in the initial view, while allowing the user to quickly and easily drill down for deeper insights with the use of thoughtfully placed slicers and cross-filtering visuals. This report is intuitive to use and easy to read, making data-driven education data analysis accessible even to users without a background in Power BI.

This Power BI education analytics report is based on the challenge submission with minor refinements by the ZoomCharts team. See the original submission here.

How To Use This Report Template

To interact with this Power BI report, simply click any active elements directly on the charts. Download this report to see all the settings, formulas, and calculations. Try it out with your own data by making a few adjustments.

ZoomCharts visuals used

Drill Down Combo PRO Drill Down Combo PRO
Drill Down Combo Bar PRO Drill Down Combo Bar PRO
Drill Down Donut PRO Drill Down Donut PRO

4U Report Challenges

Participate in data challenges, build and submit reports to get free template downloads.

Join Community

Mobile view allows you to interact with the report. To Download the template please switch to desktop view.

Similar reports

All Reports 26 results
New
Report Card

Student Performance Power BI Report 26

986

New
Report Card

Student Performance Power BI Report 25

694

New
Report Card

Academic Performance Power BI Dashboard

2026

Explore all reports

Was this helpful? Thank you for your feedback!

Sorry about that.

How can we improve it?

School Analytics Power BI Report by Norman Reynaldo Sabillon Castro

Overhauled by ZoomCharts

43061

ZoomCharts

Welcome to ZoomCharts

You’re almost there! Create an account to download this report.

Sign up with Microsoft
or

Verify your email address

We have sent a code to your email address. Please input the code below.

Didn't receive code? Request again (after 30 seconds)

Already have an account? Log in

Get access to this and 2,000+ more reports

Skip weeks of building.

Pick a template, connect your data, ship in days.

Trusted by 1M+ users.

Used by Power BI developers, consultants, and managers.

100+ new reports monthly.

The gallery keeps growing - always fresh, always relevant.

Report
School Analytics Power BI Report by Norman Reynaldo Sabillon Castro
ZoomCharts

Log in to your ZoomCharts account

You’re almost there! Log in to download this report.

Log in with Microsoft
or
Forgot password?

Reset your password

We'll email you instructions on how to reset your password

Don't have an account? Sign up

Get access to this and 2,000+ more reports

Skip weeks of building.

Pick a template, connect your data, ship in days.

Trusted by 1M+ users.

Used by Power BI developers, consultants, and managers.

100+ new reports monthly.

The gallery keeps growing - always fresh, always relevant.

Report
School Analytics Power BI Report by Norman Reynaldo Sabillon Castro

Please add credits

You have 0 available downloads.
Get more credits or upgrade your plan to continue.

View pricing
logo
[email protected]
+44 204 577 3993
logo

Products

Drill Down Bubble PRO Drill Down Line PRO Drill Down Network PRO Drill Down Waterfall PRO Drill Down Graph PRO Drill Down Combo PRO Drill Down Combo Bar PRO Drill Down Donut PRO Drill Down Pie PRO Drill Down TimeSeries PRO Drill Down Timeline PRO Drill Down Map PRO Drill Down Scatter PRO All Visuals

Resources

Report Examples Webinars Blog ZoomCharts Academy Visuals Gallery Documentation Custom Visual Development Subscribe to News

Solutions

Custom Visual Development

Company

Pricing About Us Partners Leave feedback Join PowerGroup EU Funding

Help

ZoomCharts Assistance Contact Sales Contact Support FAQ AI Information

Drill Down Line PRO Drill Down Bubble PRO Drill Down Network PRO Drill Down Waterfall PRO Drill Down Graph PRO Drill Down Combo PRO Drill Down Combo Bar PRO Drill Down Donut PRO Drill Down Pie PRO Drill Down TimeSeries PRO Drill Down Timeline PRO Drill Down Map PRO Drill Down Scatter PRO All Visuals

Report Examples Webinars Blog ZoomCharts Academy Visuals Gallery Documentation Custom Visual Development Subscribe to News

Custom Visual Development

Pricing About Us Partners Leave feedback Join PowerGroup EU Funding

ZoomCharts Assistance Contact Sales Contact Support FAQ AI Information
+44 204 577 3993
[email protected]

Ready to get in touch?

Contact our experts with any question about Power BI and ZoomCharts for Free!

Contact us

© 2026, Data Visualization Software Lab

U.S. Patents No. 11,645,343; 11,921,804; 12,346,389

Cookies
Privacy Policy
Global
Legal
Patent
warning

Error message

success

Success info: Done!

ZoomCharts AI Assistant

We noticed you're using an old OS version.

For the best experience, we recommend upgrading to ensure that all website features display correctly.

Cookie settings

We use necessary cookies for site functionality, as well as statistic, marketing, and preference cookies to enhance your experience. For more information and to manage your preferences, please visit our Cookie policy