25611
Retail Supply Chain Management & Sales Analysis Report by Toni Hewlett
Share template with others
Summary
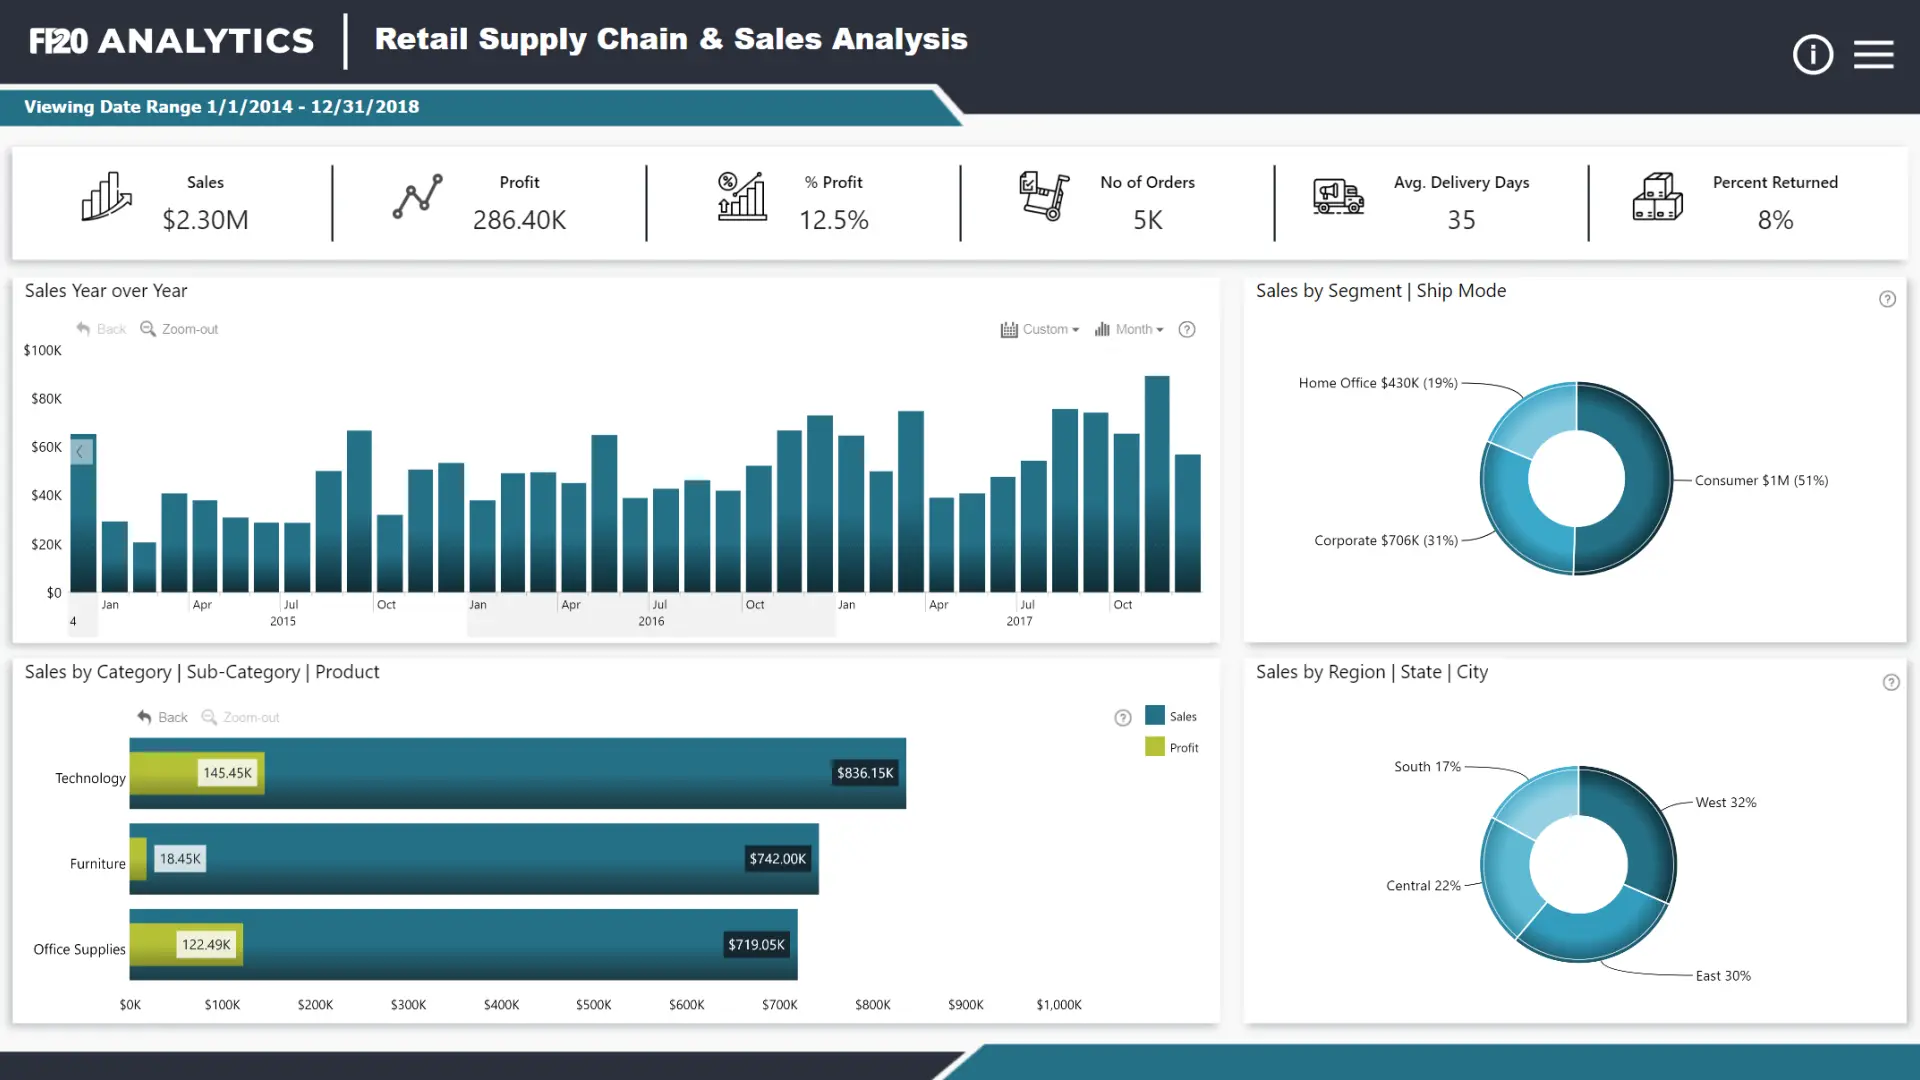
This retail supply chain management report was one of the top entries for the FP20 Analytics October 2023 ZoomCharts Challenge. The contestant visualized a challenge dataset of sales data for a North American retail network.
The report was noted by the ZoomCharts team for its simple and easy-to-read layout, which consists of a ribbon of KPI cards on the top for quick insights, and a selection of interactive visuals that not just visualize key metrics, but also act as filtering and navigation tools.
The Power BI retail analysis sample report on this page is based on the challenge submission with minor refinements by ZoomCharts. See the original submission here.
How To Use This Report Template
To interact with this Power BI report, simply click any active elements directly on the charts.
Download this report to see all the settings, formulas, and calculations. Try it out with your own data by making a few adjustments.
ZoomCharts visuals used
Need help?
Send your question to ZoomCharts assistant, and we will respond to you as soon as possible.
Contact UsMobile view allows you to interact with the report. To Download the template please switch to desktop view.

ZoomCharts Academy
Learn ZoomCharts with experts and become certified!
Go to Academy!
Was this helpful? Thank you for your feedback!
Sorry about that.
How can we improve it?

