19732
Movie Industry Insights Power BI Report by Prathamesh Sawant
Movie Industry Insights Power BI Report by Prathamesh Sawant
Report Author: Prathamesh Sawant
19732
Share template with others
Summary
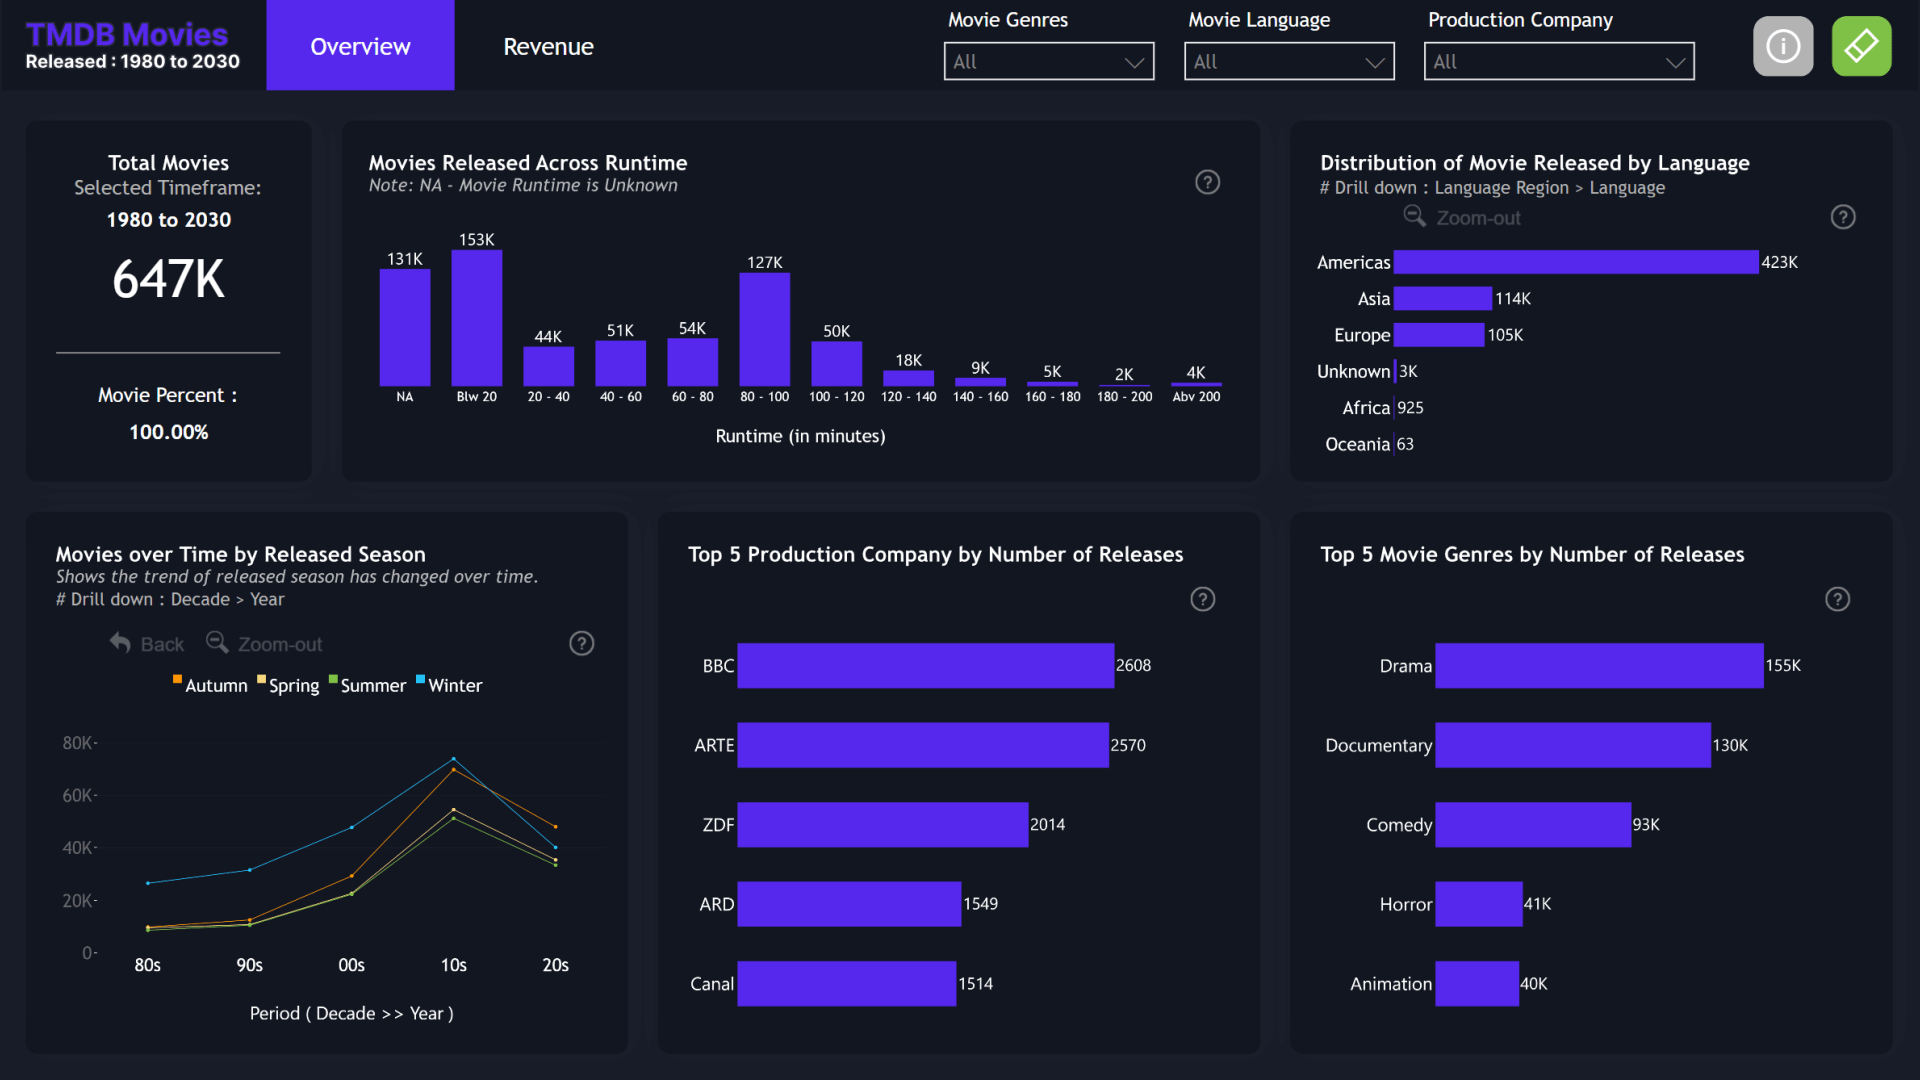
This Power BI report is based on the winning entry for ZoomCharts Mini Challenge which was hosted as a part of the Onyx Data April 2024 Challenge. The challenge dataset was based on The Movie Database (TMDB), and the report aims to explore trends in the movie industry.
With multiple interactive visuals, users can explore the the number of movie releases per genre, release season, movie runtime, and language, while the second page reveals the correlation between these factors and movie revenue. ZoomCharts team noted the visually pleasing report design, and the thoughtful implementation of drill down and cross-filtering for an intuitive user experience.
The report is based on the challenge submission with minor refinements by the ZoomCharts team. See the original submission here.
How To Use This Report Template
To interact with this Power BI report, simply click any active elements directly on the charts.
Download this report to see all the settings, formulas, and calculations. Try it out with your own data by making a few adjustments.
4U Report Challenges
Participate in data challenges, build and submit reports to get free template downloads.
Join CommunityMobile view allows you to interact with the report. To Download the template please switch to desktop view.

Was this helpful? Thank you for your feedback!
Sorry about that.
How can we improve it?