108526
HR Analytics Dashboard Template for Power BI
HR Analytics Dashboard Template for Power BI
More Report pages
Overhauled by ZoomCharts
108526
Share template with others
Overview
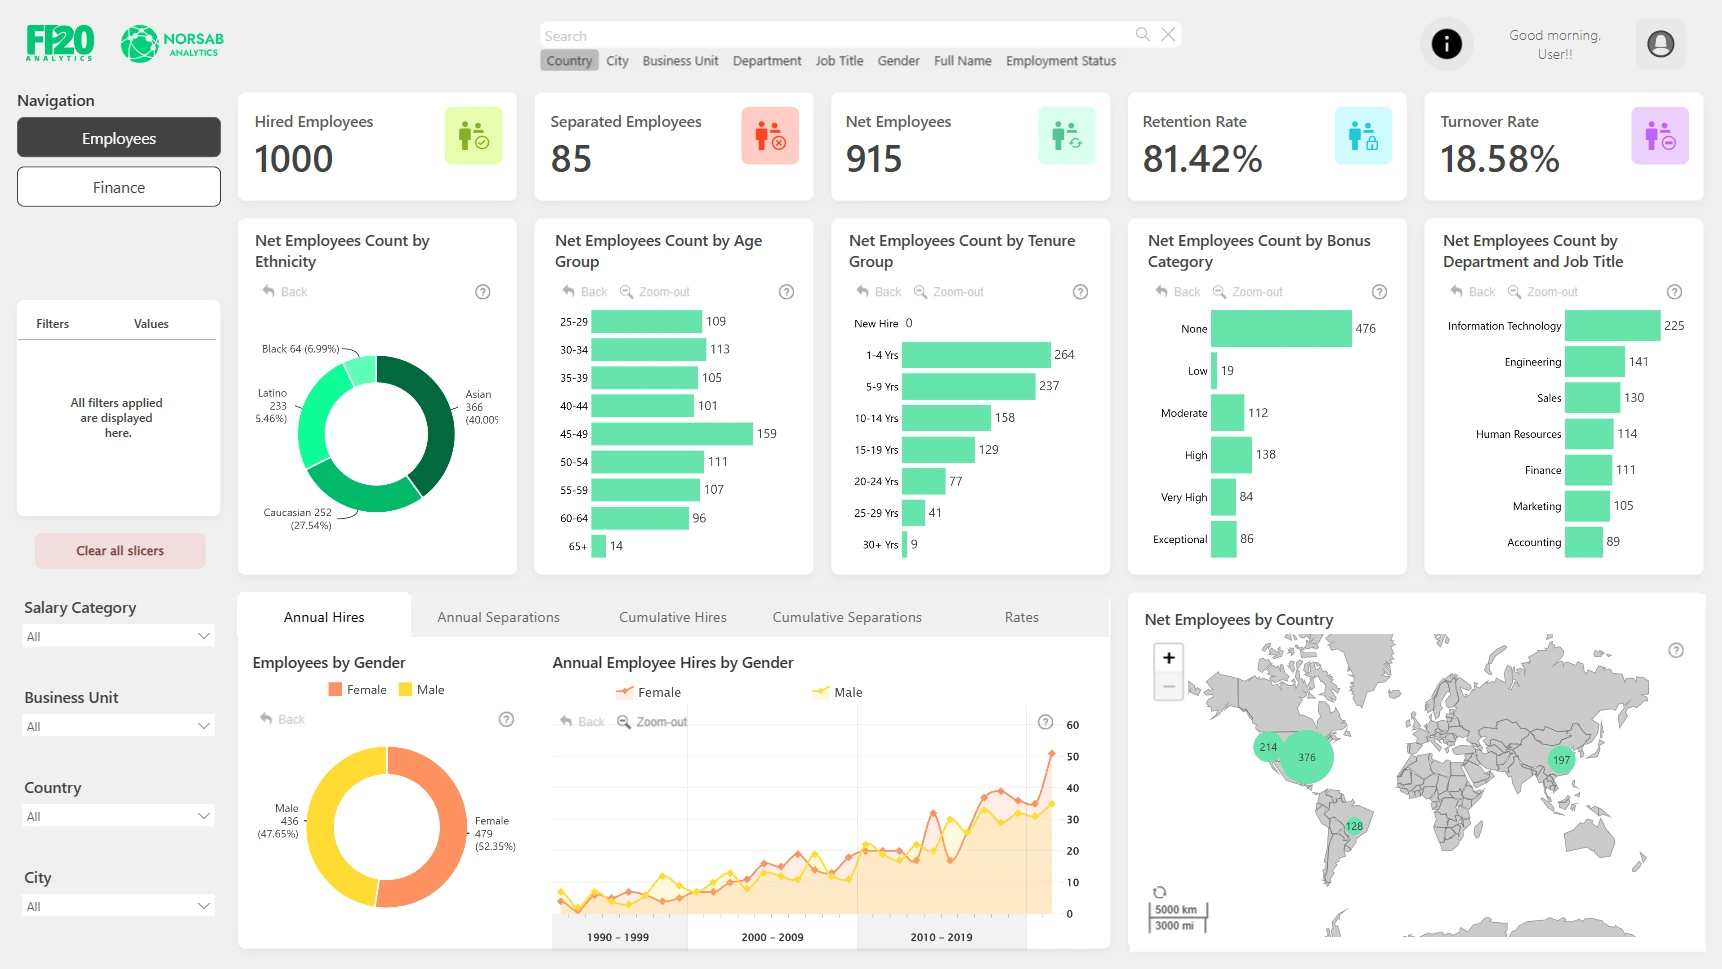
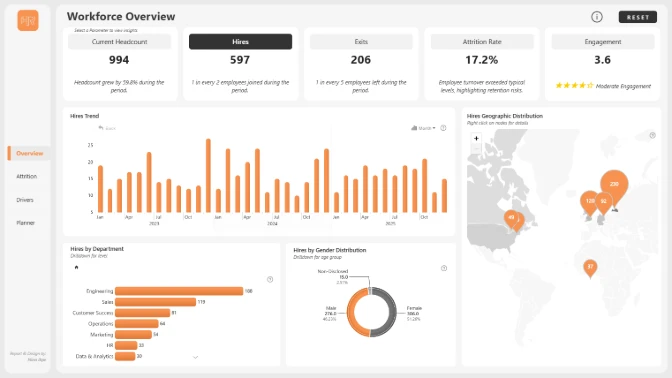
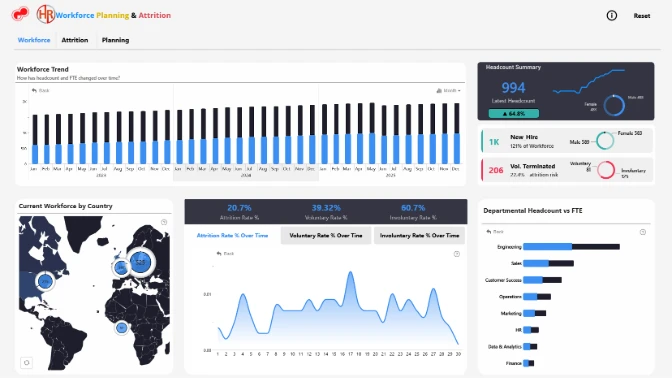
The HR Analytics Dashboard is an interactive Power BI dashboard developed for the FP20 Analytics April 2024 ZoomCharts Challenge. This dashboard offers a comprehensive suite of HR metrics, providing HR professionals with a powerful tool to gain actionable insights into workforce trends, salary distributions, employee demographics, and retention metrics.
With this HR dashboard, users can dive into salary disparities, hiring and separation trends, and long-term employee retention. By bringing all these elements together, the HR Analytics Dashboard empowers strategic planning and data-driven decision-making in human resources management.
This example dashboard is based on a challenge submission, enhanced by the ZoomCharts team to demonstrate our powerful Power BI drill-down visuals. See the original submission.
Key Features and Insights
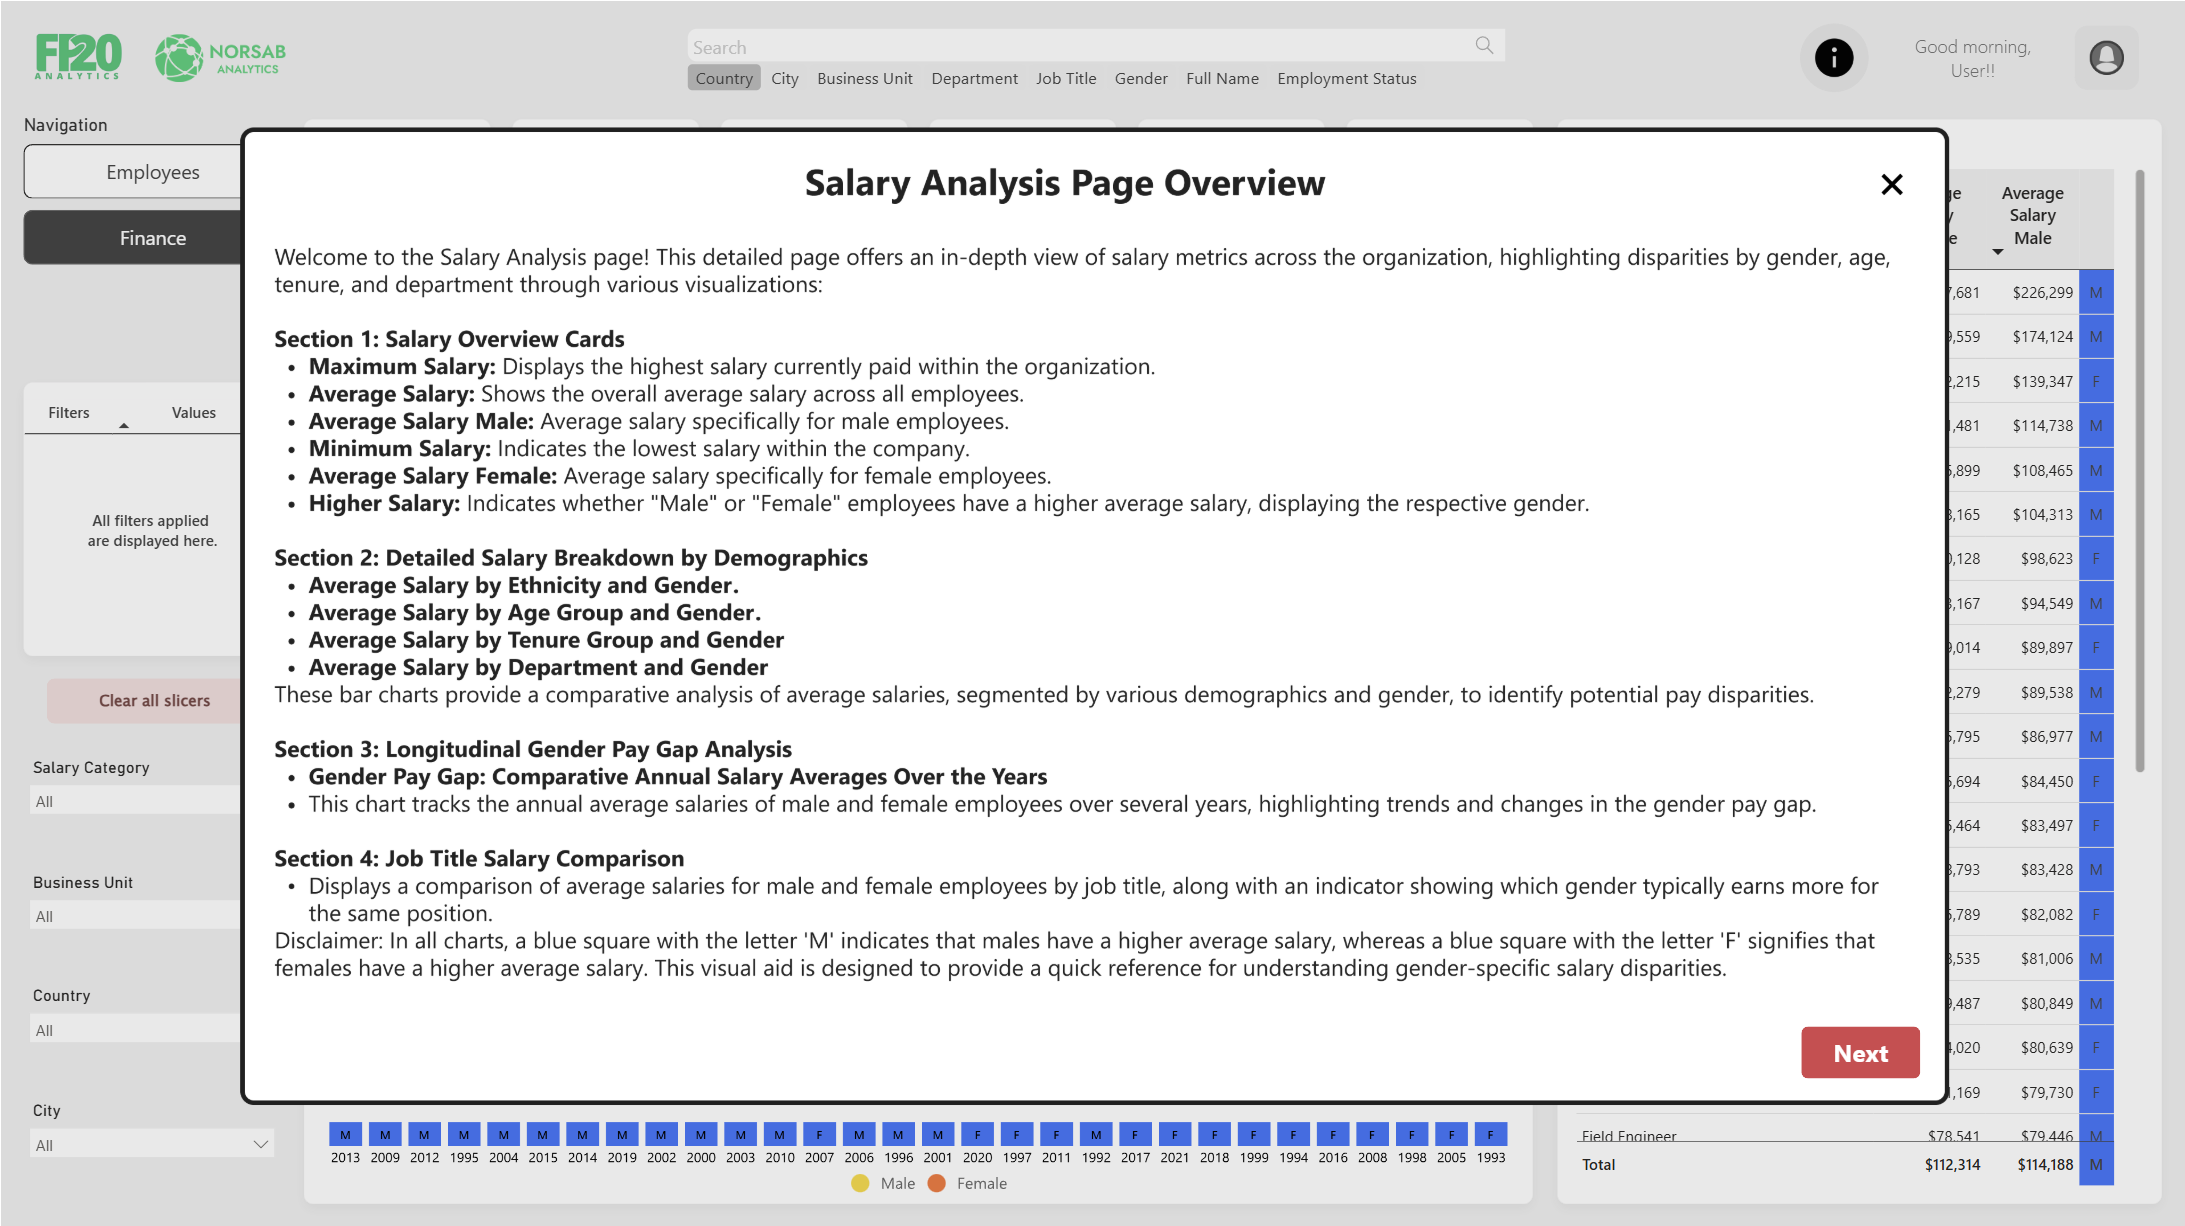
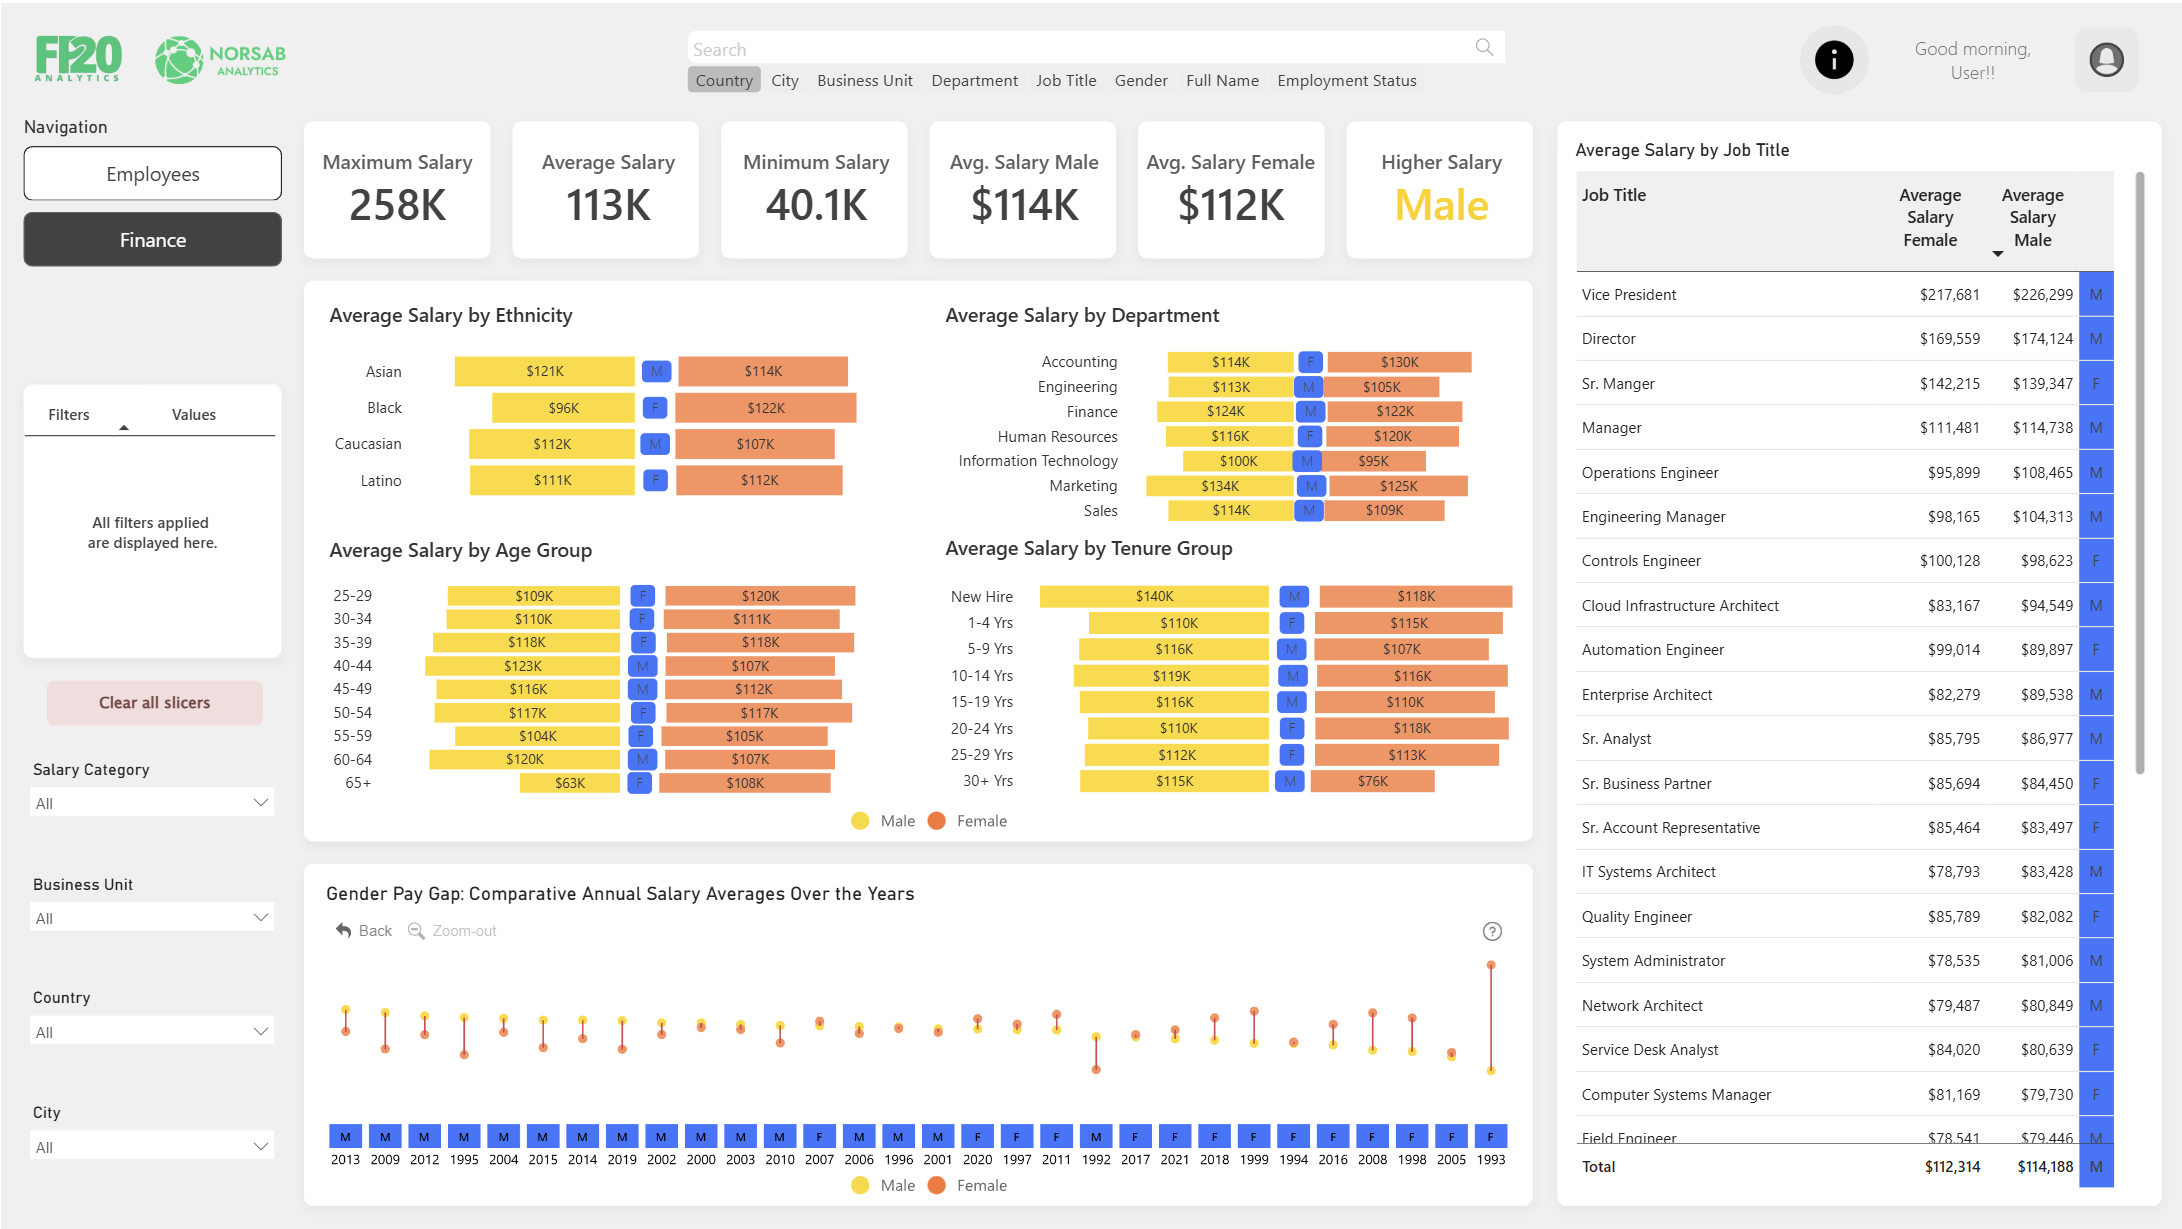
- Salary Analytics: Explore detailed salary breakdowns by department, tenure, and demographic, revealing insights into pay equity and workforce compensation trends.
- Employee Demographics: Visualize employee diversity metrics, including age, gender, and experience levels across teams.
- Trend Analysis: Identify patterns over time in hiring, retention, and separations, equipping HR leaders with the tools needed to optimize workforce strategies.
- Interactive Visuals: Built with ZoomCharts’ drill-down technology, this dashboard allows users to navigate complex data intuitively, empowering them to uncover insights seamlessly.
How to Use the HR Analytics Dashboard
Interact directly with any chart element for a deeper look into specific HR metrics. Download the template to access our detailed settings, formulas, and calculations. Customize the dashboard to visualize your own data, enabling you to adapt the insights to your organization’s unique HR needs.
ZoomCharts visuals used






4U Report Challenges
Participate in data challenges, build and submit reports to get free template downloads.
Join CommunityMobile view allows you to interact with the report. To Download the template please switch to desktop view.
How to use a PBIX template
Preview the interactive report, download the PBIX file, open it in Power BI Desktop, and replace the same data connection with your own dataset.
Preview and download
Explore the report online and download the PBIX template file.
Open in Power BI Desktop
Open the downloaded PBIX file in Power BI Desktop.
Connect your data
Replace the sample data source with your own dataset.
Refresh and adjust
Refresh the model and update fields or visual were needed.
Save and share
Save your report and publish it for your audience.


