22478
Employee Turnover Report
Employee Turnover Report
Report Author: ZoomCharts
22478
Share template with others
Summary
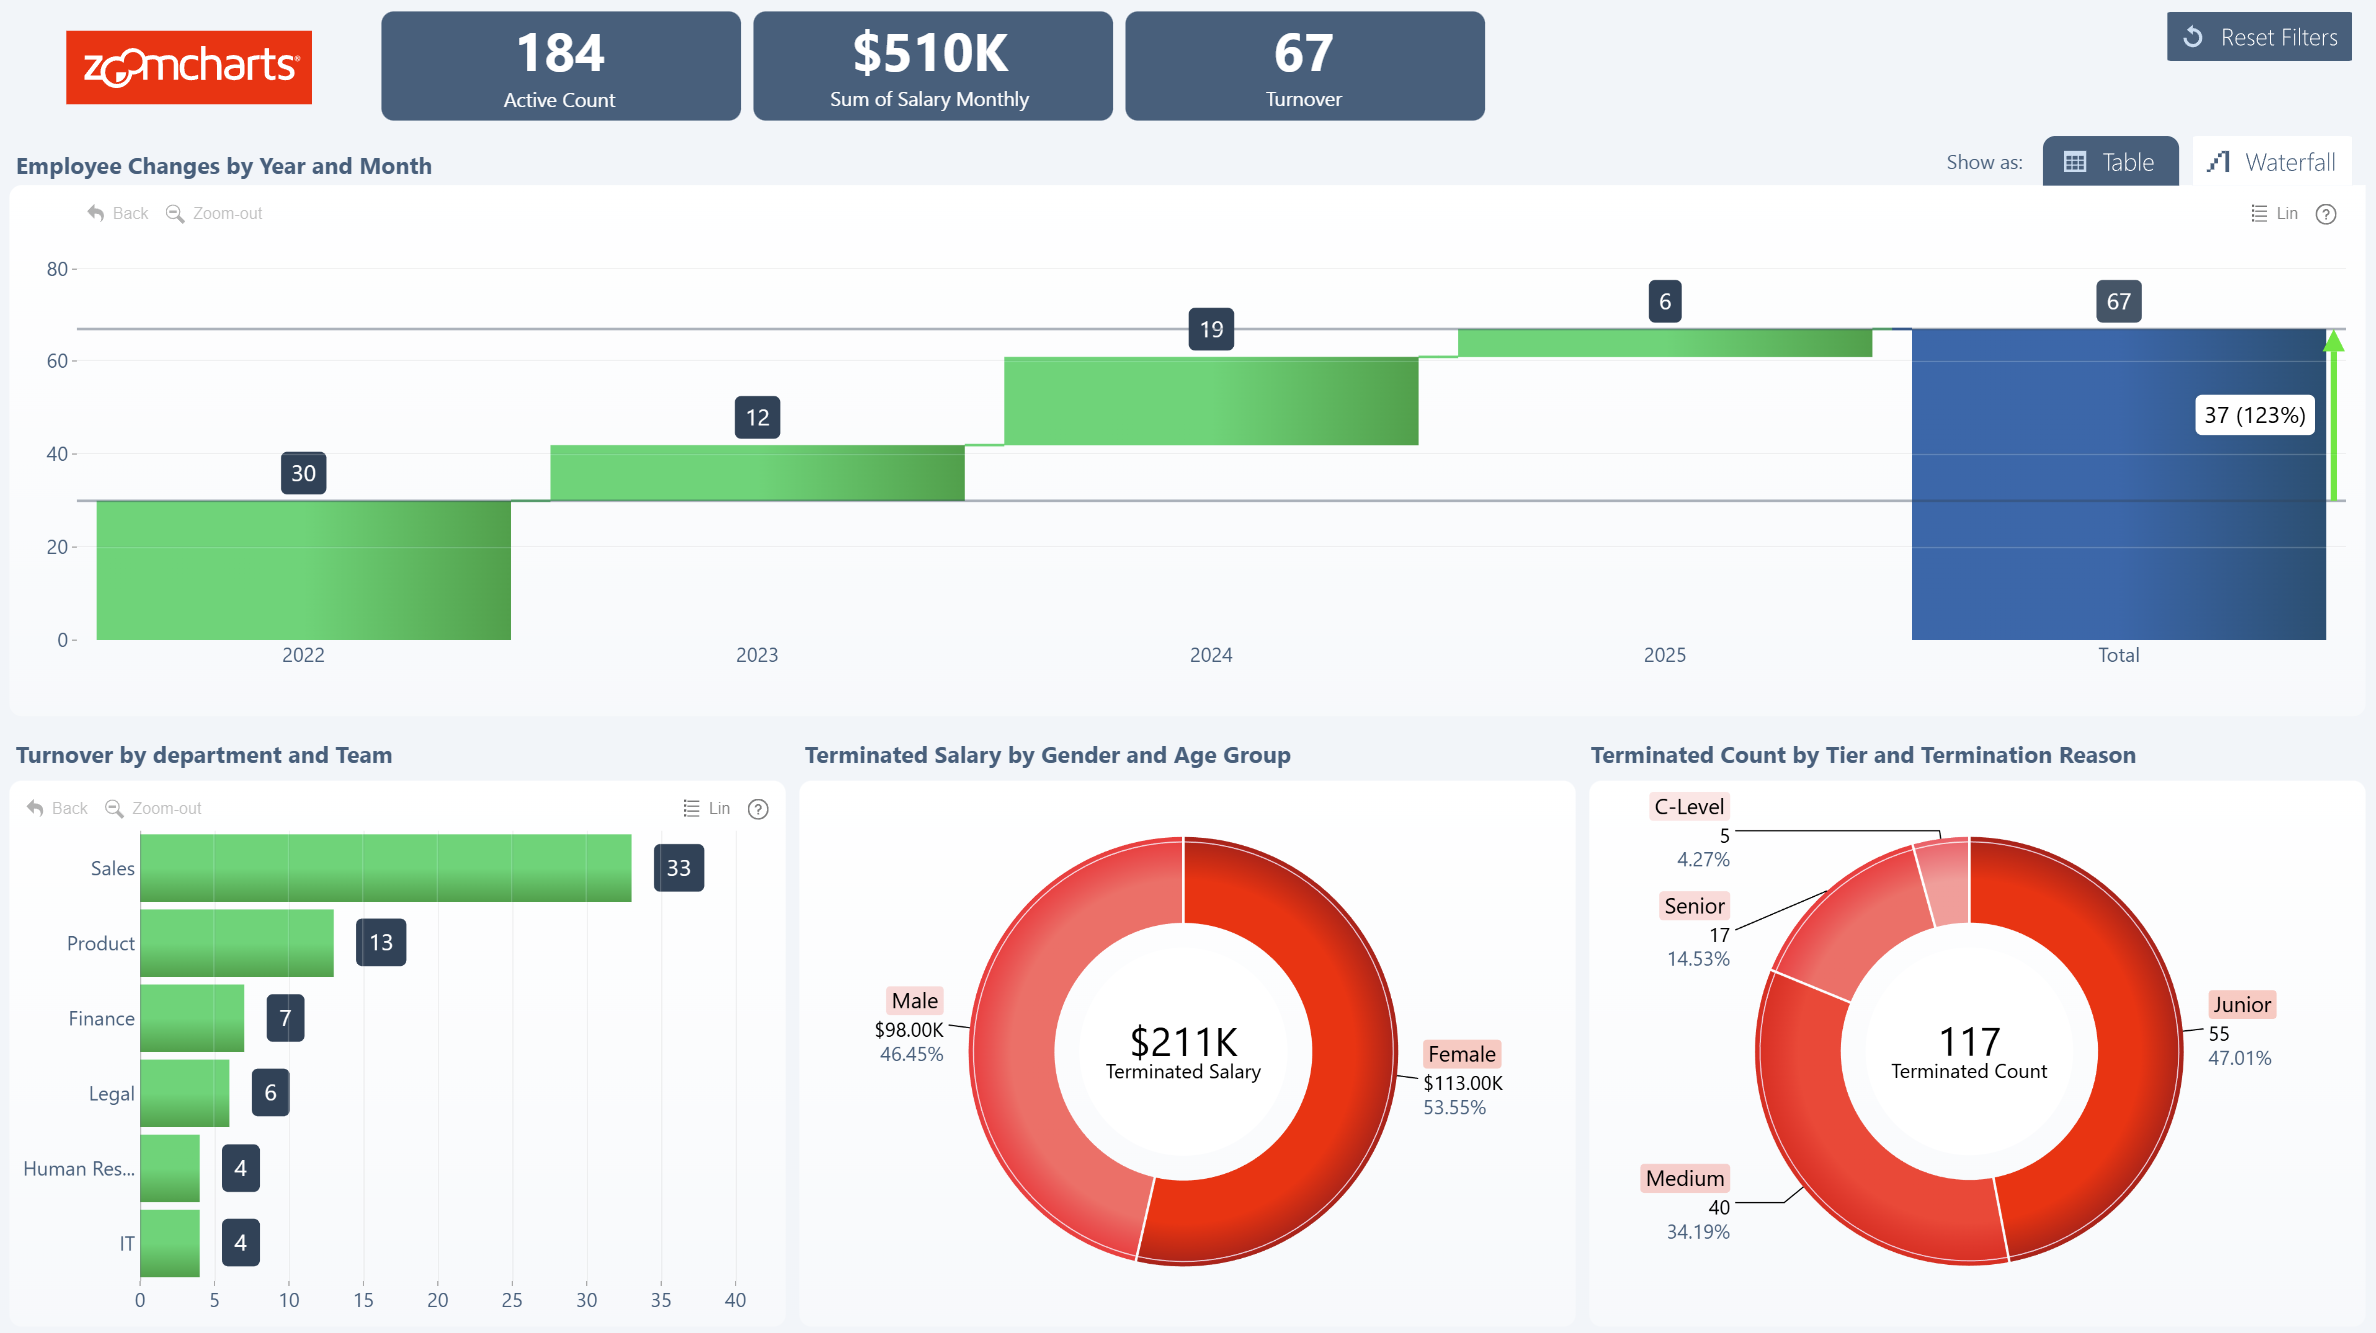
This Power BI dashboard template displays Employee Turnover and can be used to analyze and track the rate at which employees leave an organization over a specific period. It provides insights into employee retention and attrition. Built with Drill Down Visuals which feature on-chart interactions and cross-chart filtering, this Employee Turnover Report template helps provide insights and enables analysis on the overall health of the workforce. The waterfall chart shows Employee Changes. For more detailed information, you can view it as a table. The donut charts let your sort Terminated Count by Gender and Tier, and you can get an overall of Turnover by using the bar chart.
Key Features
- Drill Down Donut PRO lets you create stunning donut charts.
- Drill Down Waterfall PRO lets you create versatile waterfall charts to track net changes.
- Drill Down Combo Bar PRO offers great flexibility to help you build charts for a large number of use cases.
- On-chart interactions.
- Cross-chart filtering.
How To Use This Employee Turnover Report Template
To interact with this Power BI Employee Turnover Report, simply click any active elements directly on the charts.
Download this report to see all the settings, formulas, and calculations. Try it out with your own data by making a few adjustments.
Author:ZC
4U Report Challenges
Participate in data challenges, build and submit reports to get free template downloads.
Join CommunityMobile view allows you to interact with the report. To Download the template please switch to desktop view.
Was this helpful? Thank you for your feedback!
Sorry about that.
How can we improve it?