17644
Annual Recurring Revenue Report
Annual Recurring Revenue Report
Report Author: ZoomCharts
17644
Share template with others
Summary
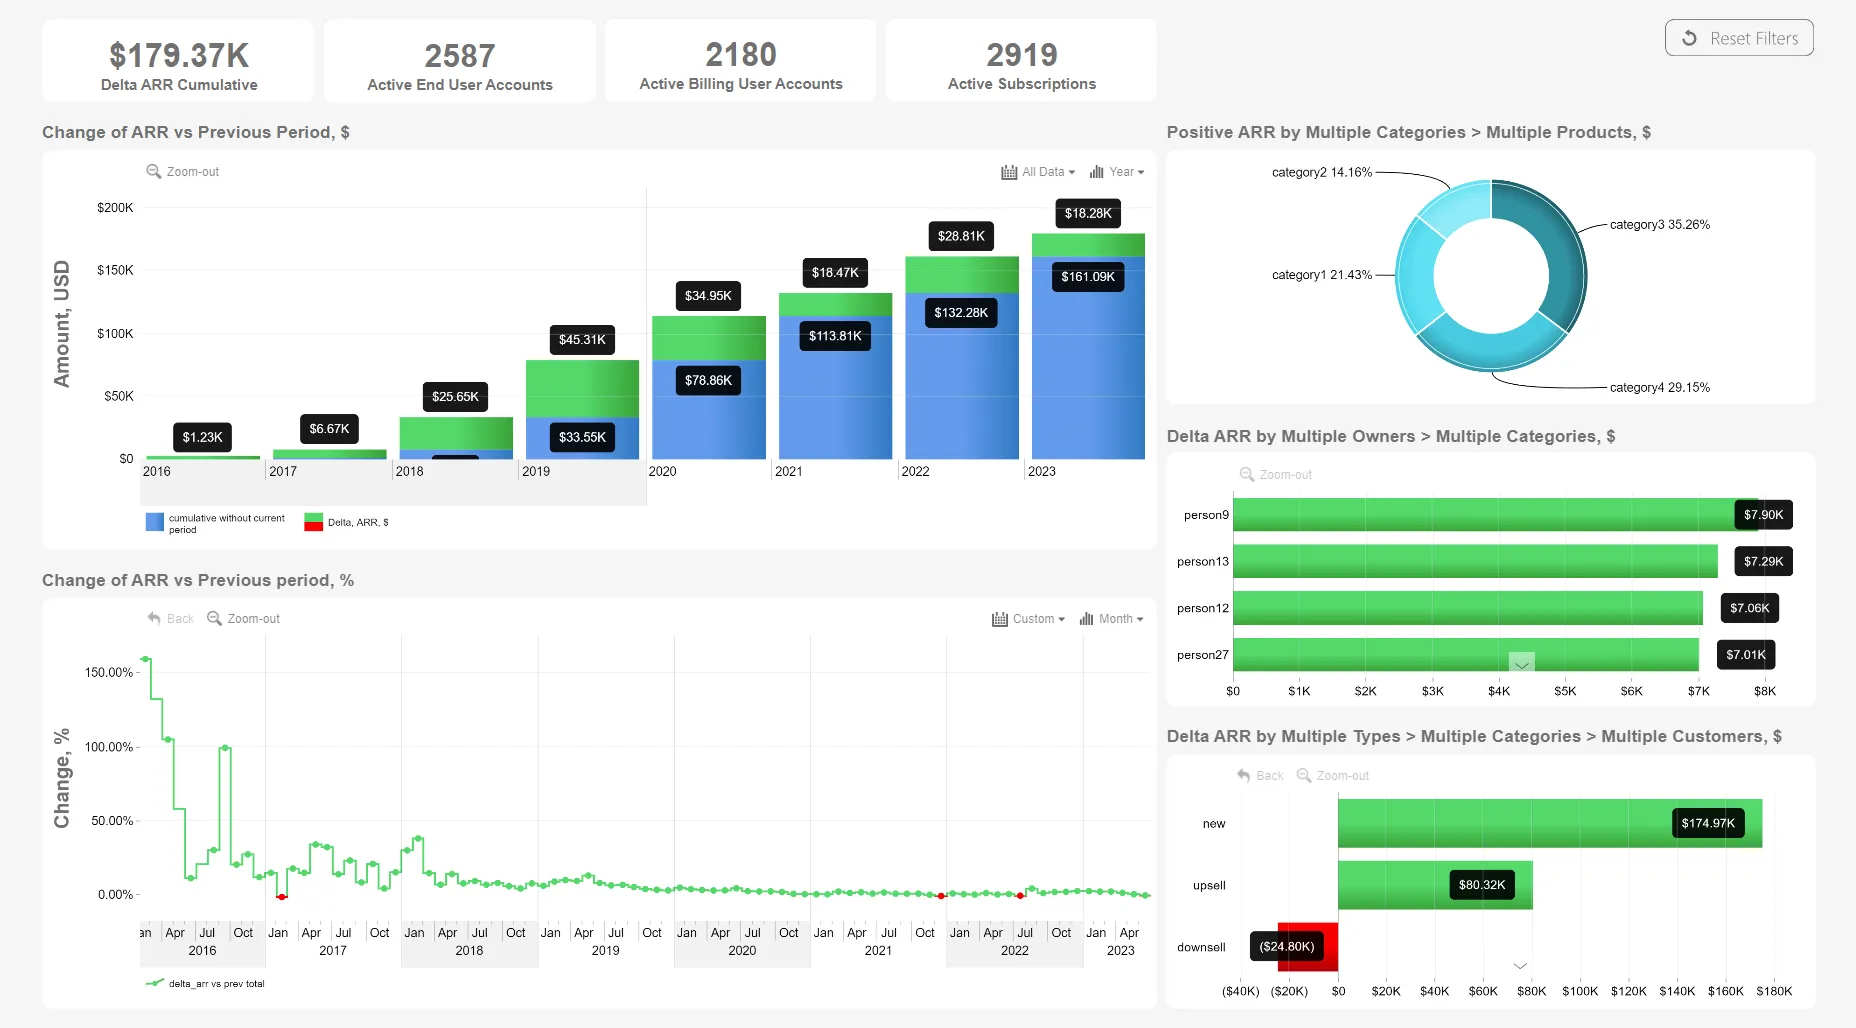
This Power BI dashboard template depicts annual recurring revenue for multiple products. Comprised of Drill Down Visuals which feature on-chart interactions and cross-chart filtering, this annual recurring revenue report template lets you uncover insights easily with just a few clicks and no slicers.
With this report template, you can view changes in annual recurring revenue compared to previous years and periods. Using the donut and bar charts, you can easily see and compare annual recurring revenue by categories like product, seller, client etc., and use the data to discern future revenue prediction and growth. You can also click on each category to easily apply a filter to the entire report in an instant.
Key Features
- Drill Down Donut PRO lets you create stunning donut charts.
- Drill Down Timeline PRO lets you visualize time-based data using DAX calculated measures.
- Drill Down Combo Bar PRO offers great flexibility to help you build charts for a large number of use cases.
- On-chart interactions.
- Cross-chart filtering.
How To Use This Annual Recurring Revenue Report Template
To interact with this Power BI Annual Recurring Revenue Report, simply click any active elements directly on the charts.
Download this report to see all the settings, formulas, and calculations. Try it out with your own data by making a few adjustments.
Author:ZC
4U Report Challenges
Participate in data challenges, build and submit reports to get free template downloads.
Join CommunityMobile view allows you to interact with the report. To Download the template please switch to desktop view.
Was this helpful? Thank you for your feedback!
Sorry about that.
How can we improve it?