Feel free to leave your vote:
1
Share template with others
Summary
Report submitted for the FP20 Analytics ZoomCharts Challenge, January 2025. The report was built using the Airline Delays Dataset and includes ZoomCharts custom Drill Down PRO visuals for Power BI.
Author's description:
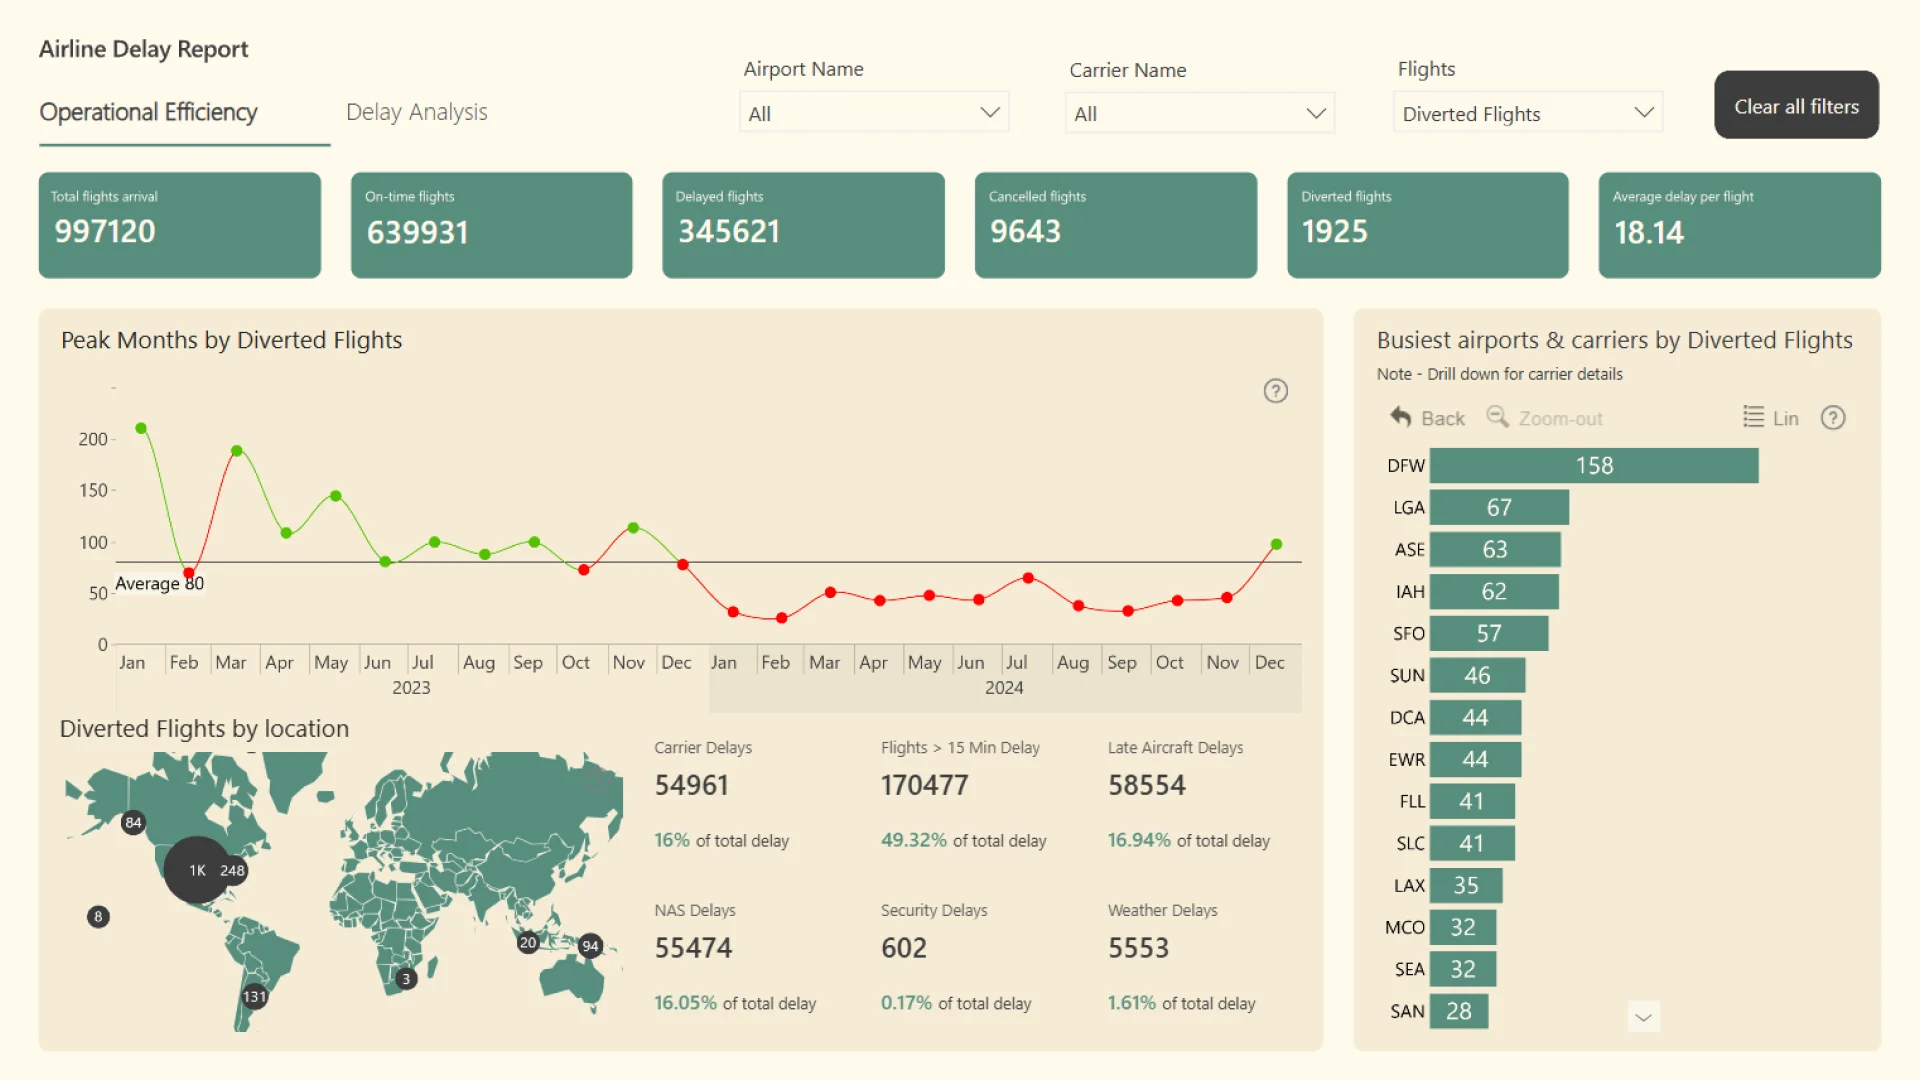
This Power BI project provides insights into airline operational efficiency and delay patterns. It visualizes key metrics such as flight arrivals, delays, cancellations, and diversions while analyzing delay causes and their impacts.
Key Features: Operational Insights: Analyze total flight performance, peak diversion months, and global diversion hotspots.
Delay Analysis: Breakdown of delay reasons and identification of the most impacted carriers and airports. Interactive Filters: View data by delay reason, carrier, and performance metrics.
Business Impact: The dashboard helps airlines and airport authorities identify operational bottlenecks, optimize resource allocation, and enhance customer service by minimizing delays.
Mobile view allows you to interact with the report. To Download the template please switch to desktop view.