Feel free to leave your vote:
0
Share template with others
Summary
Report submitted for Onyx Data DataDNA ZoomCharts Mini Challenge, August 2024. The report was built based on Fitness Company Finance Dataset and includes ZoomCharts custom Drill Down PRO visuals for Power BI.
Author's description:
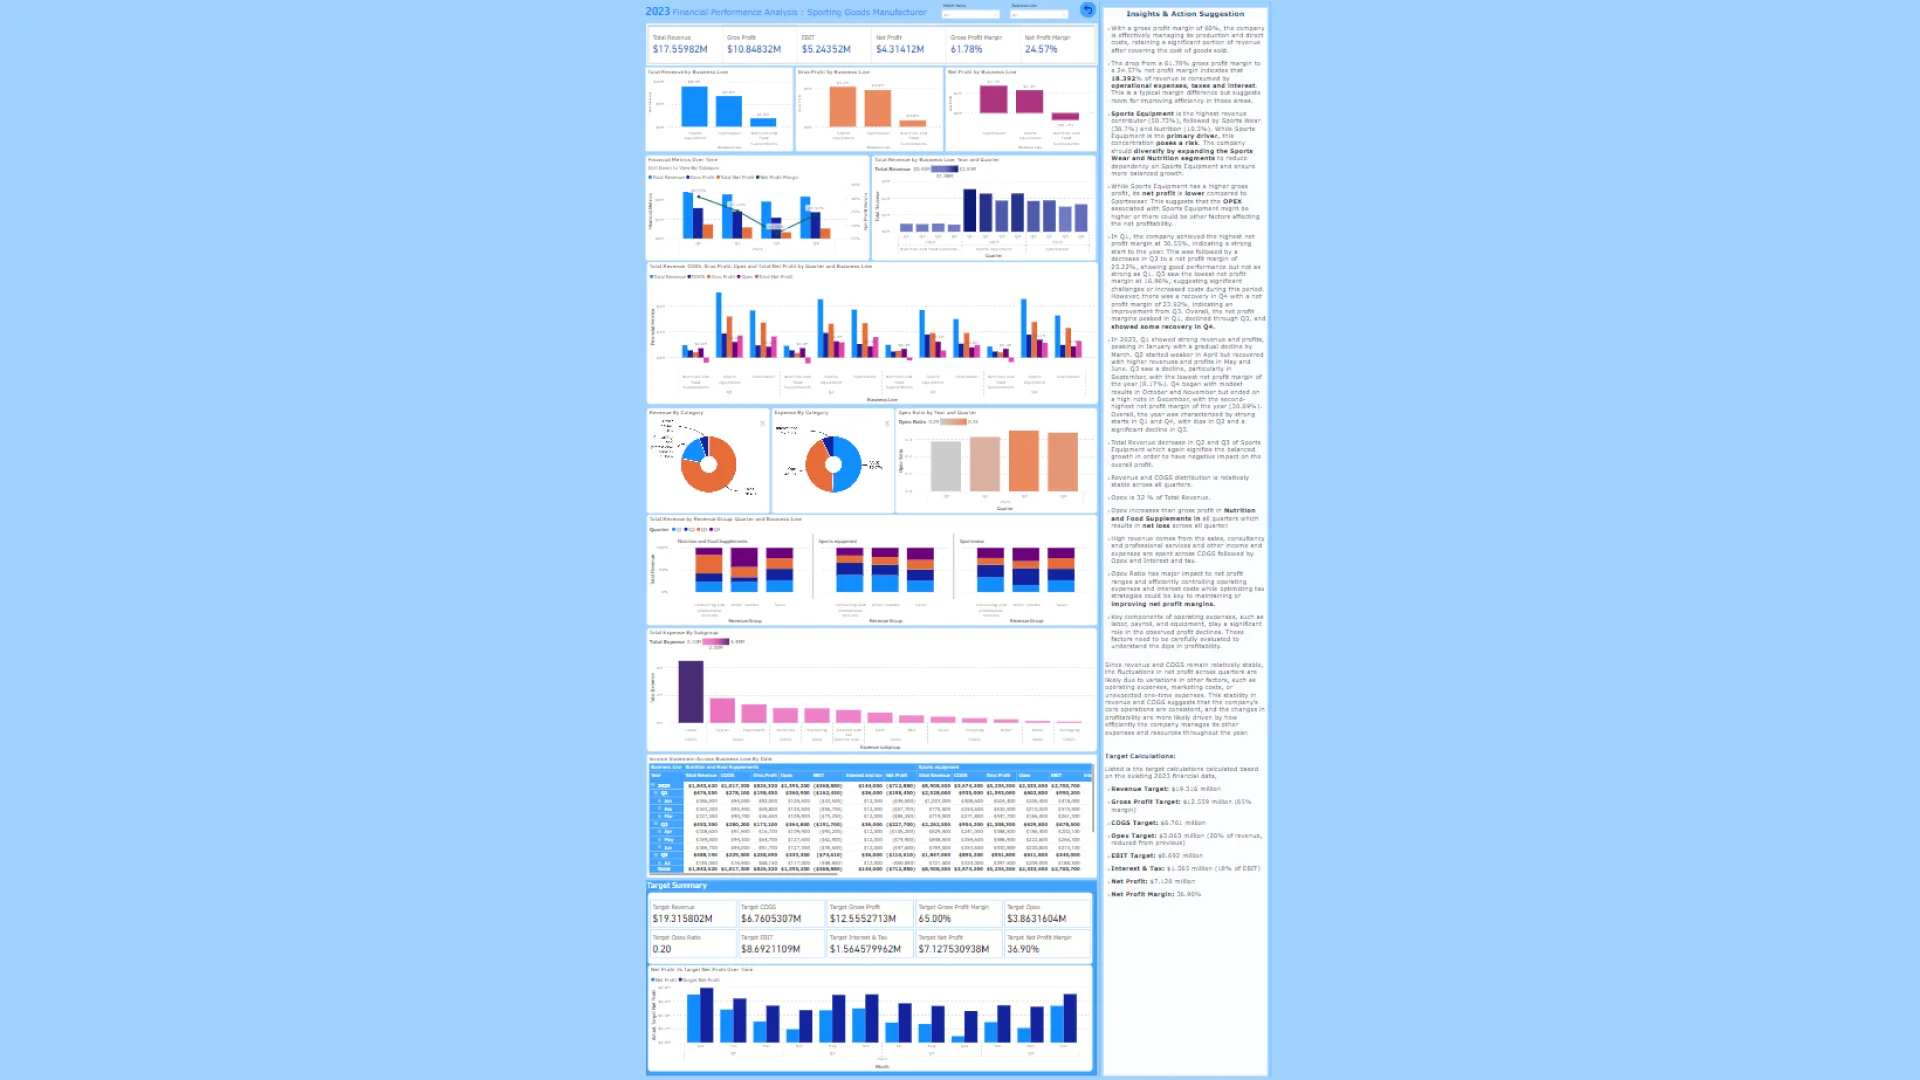
Using Power BI, ETL with Power Query, and DAX, I conducted a thorough evaluation of the company’s financial performance. Here’s a snapshot of what I’ve achieved:
🔍 Detailed Analysis:
- Revenue Breakdown: Examined performance across business lines: Sports Equipment, Nutrition and Food Supplements, and Sportswear.
- COGS: Analyzed the Cost of Goods Sold across business lines.
- Gross Profit: Assessed margins to pinpoint areas of strength and opportunities for improvement.
- Operating Expenses (OPEX): Reviewed and optimized cost management strategies.
- EBIT: Calculated to gauge operational efficiency and profitability.
- Net Profit: Evaluated profit margins to identify key drivers of profitability and areas for cost optimization.
📈 Key Insights and Actions:
- Identified variations in net profit margins and provided actionable recommendations for enhancing profitability.
- Set ambitious targets for revenue, COGS, OPEX, EBIT, and net profit to align with strategic growth objectives.
🎯 Target Financial Indicators Suggested:
- Revenue Target: $19.316 million
- Gross Profit Target: $12.559 million (65% margin)
- OPEX Target: $3.863 million (20% of revenue)
- Net Profit Target: $7.128 million (36.90% margin)
ZoomCharts visuals used
Mobile view allows you to interact with the report. To Download the template please switch to desktop view.