logo
For Power BI
  • Products
    • Drill Down Donut Pro Drill Down Donut PRO
    • Drill Down Pie Pro Drill Down Pie PRO
    • Drill TimeSeries Pro Drill Down TimeSeries PRO
    • Drill Combo Pro Drill Down Combo PRO
    • Drill Map Pro Drill Down Map PRO
    • Drill Scatter Pro Drill Down Scatter PRO
    • Drill Down Network Pro Drill Down Network PRO
    • Drill Down Waterfall Pro Drill Down Waterfall PRO
    • Drill Down Graph Pro Drill Down Graph PRO
    • Drill Down Timeline Pro Drill Down Timeline PRO
    • Drill Down Combo Bar PRO Drill Down Combo Bar PRO

    Video tutorials

    Watch Now

    More than 90 videos on how to enhance Power BI with ZoomCharts

    Learn more
    All visuals
  • Resources

      Resources

    • Documentation
    • Report Examples
    • Blog
    • Webinars
    • Video Tutorials
    • Visuals Gallery

    Support

    • ZoomCharts Assistance
    • Contact Sales
    • Contact Support
    • FAQ

    Challenges

    Challenges

    Improve your report creation skills by participating in free challenges for report creators.

    Learn more
    Start trial
  • Services
    • Power BI Report Development
    • Custom Visual Development
  • Challenges
  • Pricing
Request a quote Start Free Book a Demo Sign in
Get it now
Go back

Contents

Go back

Airline Delays Report

Report Author: Oriol Ferret

Report
Report Interact

Feel free to leave your vote:

4

Share template with others

Summary

Report submitted for the FP20 Analytics ZoomCharts Challenge, January 2025. The report was built using the Airline Delays Dataset and includes ZoomCharts custom Drill Down PRO visuals for Power BI.

Author's description:

1. What are the busiest months and airports for flights?

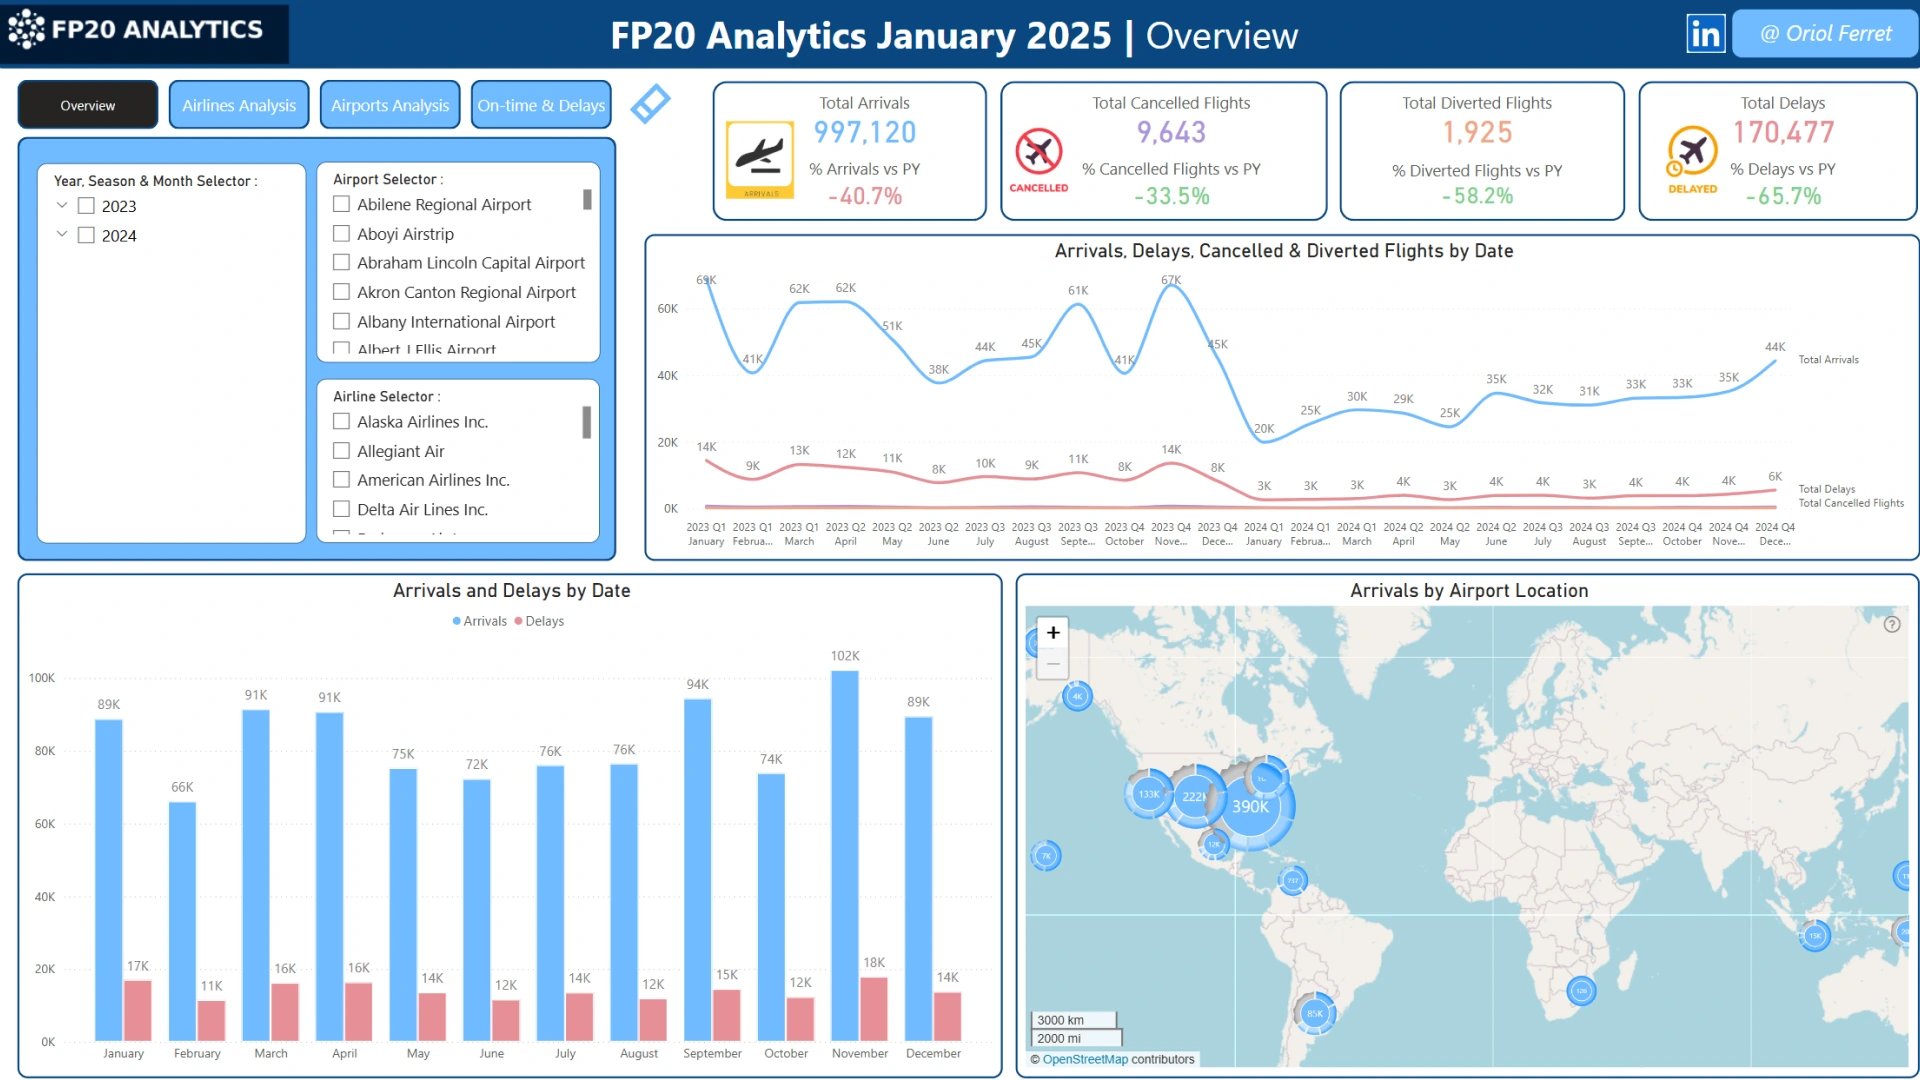
The highest number of arrivals occur in November, September, March, April, January, and December.

2. Which months experience the highest delay rates?

Delays are most frequent in November, January, March, April, and September.

3. How do delay patterns vary across different airlines?

The airlines with the most delays closely match those with the highest flight volumes, differing only in order.

  • Top 5 airlines by arrivals:

    • Southwest Airlines Co.

    • Delta Airlines Inc.

    • SkyWest Airlines Inc.

    • American Airlines Inc.

    • United Airlines Inc.

  • Top 5 airlines by delays:

    • Southwest Airlines Co.

    • SkyWest Airlines Inc.

    • American Airlines Inc.

    • Delta Airlines Inc.

    • United Airlines Inc.

4. What are the primary causes of delays?

The top three causes of delays are:

  1. Late aircraft

  2. National Aviation System issues

  3. Carrier-related reasons

Other causes, such as weather and security breaches, contribute significantly less.

5. Which airports are most affected by weather-related delays?

The top 5 airports with the longest weather-related delays (in minutes) are:

  • Marcos Paz Airfield (Argentina)

  • Dallas/Fort Worth International Airport (USA)

  • Chicago O'Hare International Airport (USA)

  • Detroit Metropolitan Wayne County Airport (USA)

  • Denver International Airport (USA)

6. How do delays differ between peak and off-peak seasons?

To define peak and off-peak seasons, we analyzed total arrival volumes. The six months with the highest flight counts were classified as peak season, while the rest were considered off-peak.

  • Delay rate in peak season: 17.2%

  • Delay rate in off-peak season: 16.9%

Although delay rates don’t vary drastically across months, peak season months tend to experience slightly higher delays.

7. Are there geographical patterns in delay occurrences (e.g., coastal vs. inland airports)?

Yes, geographical factors significantly impact weather-related delays. Coastal and inland airports experience different types of weather disruptions based on location, terrain, and climate conditions.

8. Do certain regions experience higher delays due to weather conditions?

Yes, some regions are more prone to weather-related delays. The top 5 airports with the highest weather-related delay rates are:

  • Marcos Paz Airfield (Argentina)

  • Dallas/Fort Worth International Airport (USA)

  • Chicago O'Hare International Airport (USA)

  • Detroit Metropolitan Wayne County Airport (USA)

  • Denver International Airport (USA)

Extreme cold, snow, thunderstorms, fog, and rapid weather changes are the primary causes of delays in these locations.

9. What percentage of total flights experience delays of over 15 minutes?

17.1% of all flights experience delays exceeding 15 minutes. Further breakdowns by airline and airport are available on the On-Time & Delays page.

10. Are there airports or airlines with significantly better on-time performance?

Yes, the top-performing airlines and airports in terms of on-time performance are:

  • Top 3 airlines with the best on-time performance:

    • Hawaiian Airlines Inc.

    • Endeavor Air Inc.

    • Delta Airlines Inc.

  • Top 3 airports with the best on-time performance:

    • Mobile Downtown Airport

    • Pitt-Greenville Airport

    • Central Wyoming Regional Airport

It is important to note that these airports have fewer arrivals, which contributes to their higher on-time performance rates.

ZoomCharts visuals used

Drill Down Scatter PRO Drill Down Scatter PRO
Drill Down Map PRO Drill Down Map PRO

Mobile view allows you to interact with the report. To Download the template please switch to desktop view.

Try it in your Power BI!

New here? Fill up the form below and download!

Enjoy!

Success

Thank you for downloading the template!
We have sent a download link to your email.

For any questions, please contact us at ZoomCharts Assistance

Log in

Forgot password

Reset Password

Airline Delays Report

Share

Unfortunately this report file could not be downloaded. Please try again later.

You can contact support using chat or via email [email protected]

logo
[email protected]
+44 204 577 3993
logo

Products

Drill Down Network PRO Drill Down Waterfall PRO Drill Down Graph PRO Drill Down Combo PRO Drill Down Combo Bar PRO Drill Down Donut PRO Drill Down Pie PRO Drill Down TimeSeries PRO Drill Down Timeline PRO Drill Down Map PRO Drill Down Scatter PRO All Visuals

Resources

Report Examples Webinars Blog ZoomCharts Academy Visuals Gallery Documentation Custom Visual Development Subscribe to News

Solutions

Custom Visual Development

Company

Pricing About Us Partners Leave feedback Join PowerGroup EU Funding

Help

ZoomCharts Assistance Contact Sales Contact Support FAQ

Drill Down Network PRO Drill Down Waterfall PRO Drill Down Graph PRO Drill Down Combo PRO Drill Down Combo Bar PRO Drill Down Donut PRO Drill Down Pie PRO Drill Down TimeSeries PRO Drill Down Timeline PRO Drill Down Map PRO Drill Down Scatter PRO All Visuals

Report Examples Webinars Blog ZoomCharts Academy Visuals Gallery Documentation Custom Visual Development Subscribe to News

Custom Visual Development

Pricing About Us Partners Leave feedback Join PowerGroup EU Funding

ZoomCharts Assistance Contact Sales Contact Support FAQ
+44 204 577 3993
[email protected]

Ready to get in touch?

Contact our experts with any question about Power BI and ZoomCharts for Free!

Contact us

© 2025, Data Visualization Software Lab

U.S. Patents No. 11,645,343; 11,921,804

Cookies Policy
Manage cookies
Privacy Policy
Global
EULA
Patent
warning

Error message

success

Success info: Done!

ZoomCharts AI Assistant

We noticed you're using an old OS version.

For the best experience, we recommend upgrading to ensure that all website features display correctly.

Cookie settings

We use necessary cookies for site functionality, as well as statistic, marketing, and preference cookies to enhance your experience. For more information and to manage your preferences, please visit our Cookie policy