Feel free to leave your vote:
3
Share template with others
Summary
Report submitted for FP20 Analytics ZoomCharts Challenge, November 2023. The report was built with Tactical Crime Analysis dataset and includes ZoomCharts custom Drill Down PRO visuals for Power BI.
Author's description:
🔵 FP20 Data Challenge Report Overview The report has been segregated into Summary & Details. The summary page describes the Time-based analysis, Understanding of the UK crime types, and people's involvement in such crimes. The details sheet defines the in-depth analysis of crimes with hotspots and the correlation of persons who commit crimes. The report pages were designed for self-understanding and quick notes on visuals. The best user experience to follow, read patiently.
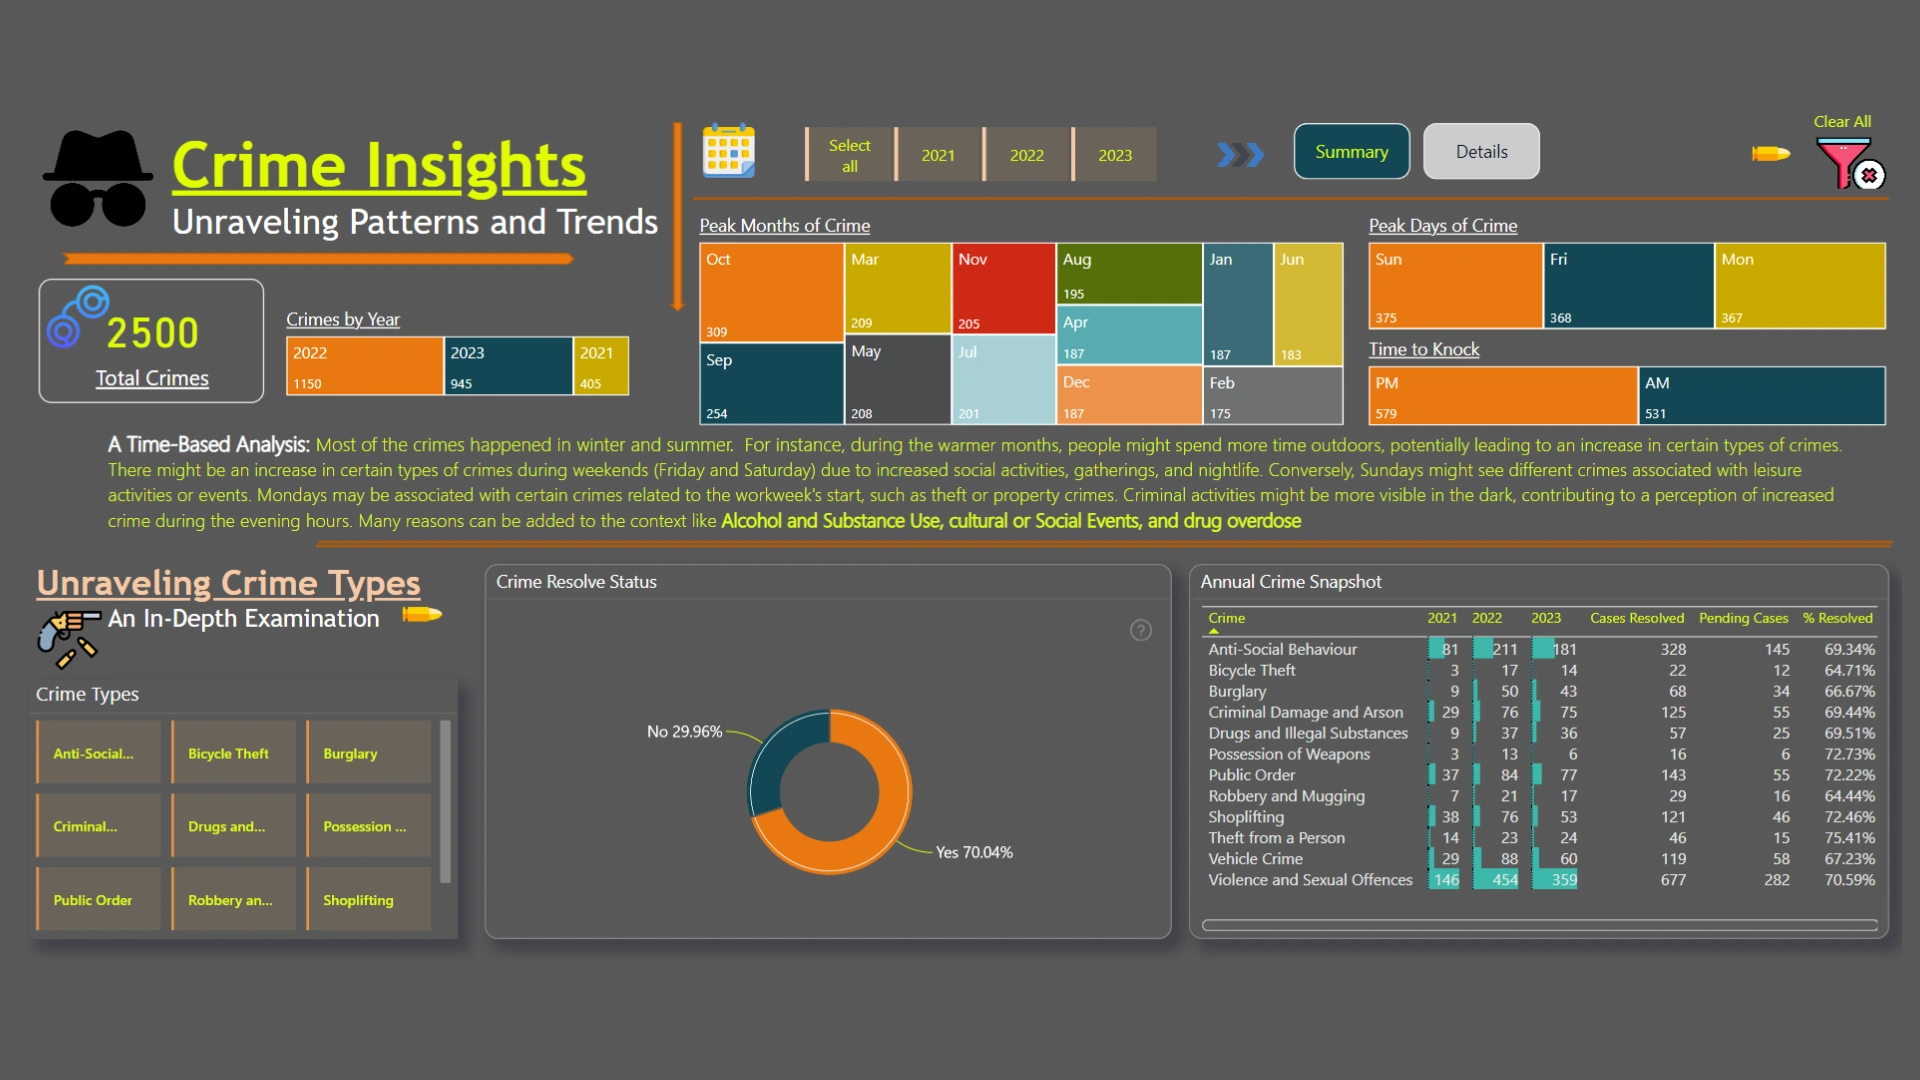
🔵 Summary Time-Based Analysis: Year slicers select the year of interest with a clear all slicers button to unselect the previous selection. >>> Highlighted the pages incorporated in the report. Clear All Slicer icon to remove the selections. A drill-through approach has been added to the crimes by year tree map to understand the monthly contribution, hot areas, and involvement of persons with those crimes.
🔸 Read the visuals > Card visual of total crimes differentiated by year, peak months, day & and hours to watch. > Analysis commentary with an explanation. Crime Types: Crime type slicers to minimize the data.
🔸 Read the visuals > ZoomCharts drill down data to know the case resolve status and the area to look on. > Table visuals of the yearly progression. > Insight and focus area commentary.
🔵 Ethnicity and Gender: Card visual of total crimes. Slicers to minimize the data based on gender.
🔸 Read the visuals > ZoomCharts drill down network pro visual to understand the relationship between the genders, age groups, and the ethnicity of people involved. > Stacked bar chart to show the gender dynamics in crime roles. > Line chart to know the crimes by year and which groups required more attention. > Insights of the visuals.
🔵Details > Drill through approach added as advised in the overview sheet. > ZoomCharts map visual shows the high crime areas with the most crimes incorporated. > Scatter plot to understand the manpower used to do the crimes. > Action points to reduce the crimes.
ZoomCharts visuals used
Mobile view allows you to interact with the report. To Download the template please switch to desktop view.
