Feel free to leave your vote:
5
Share template with others
Summary
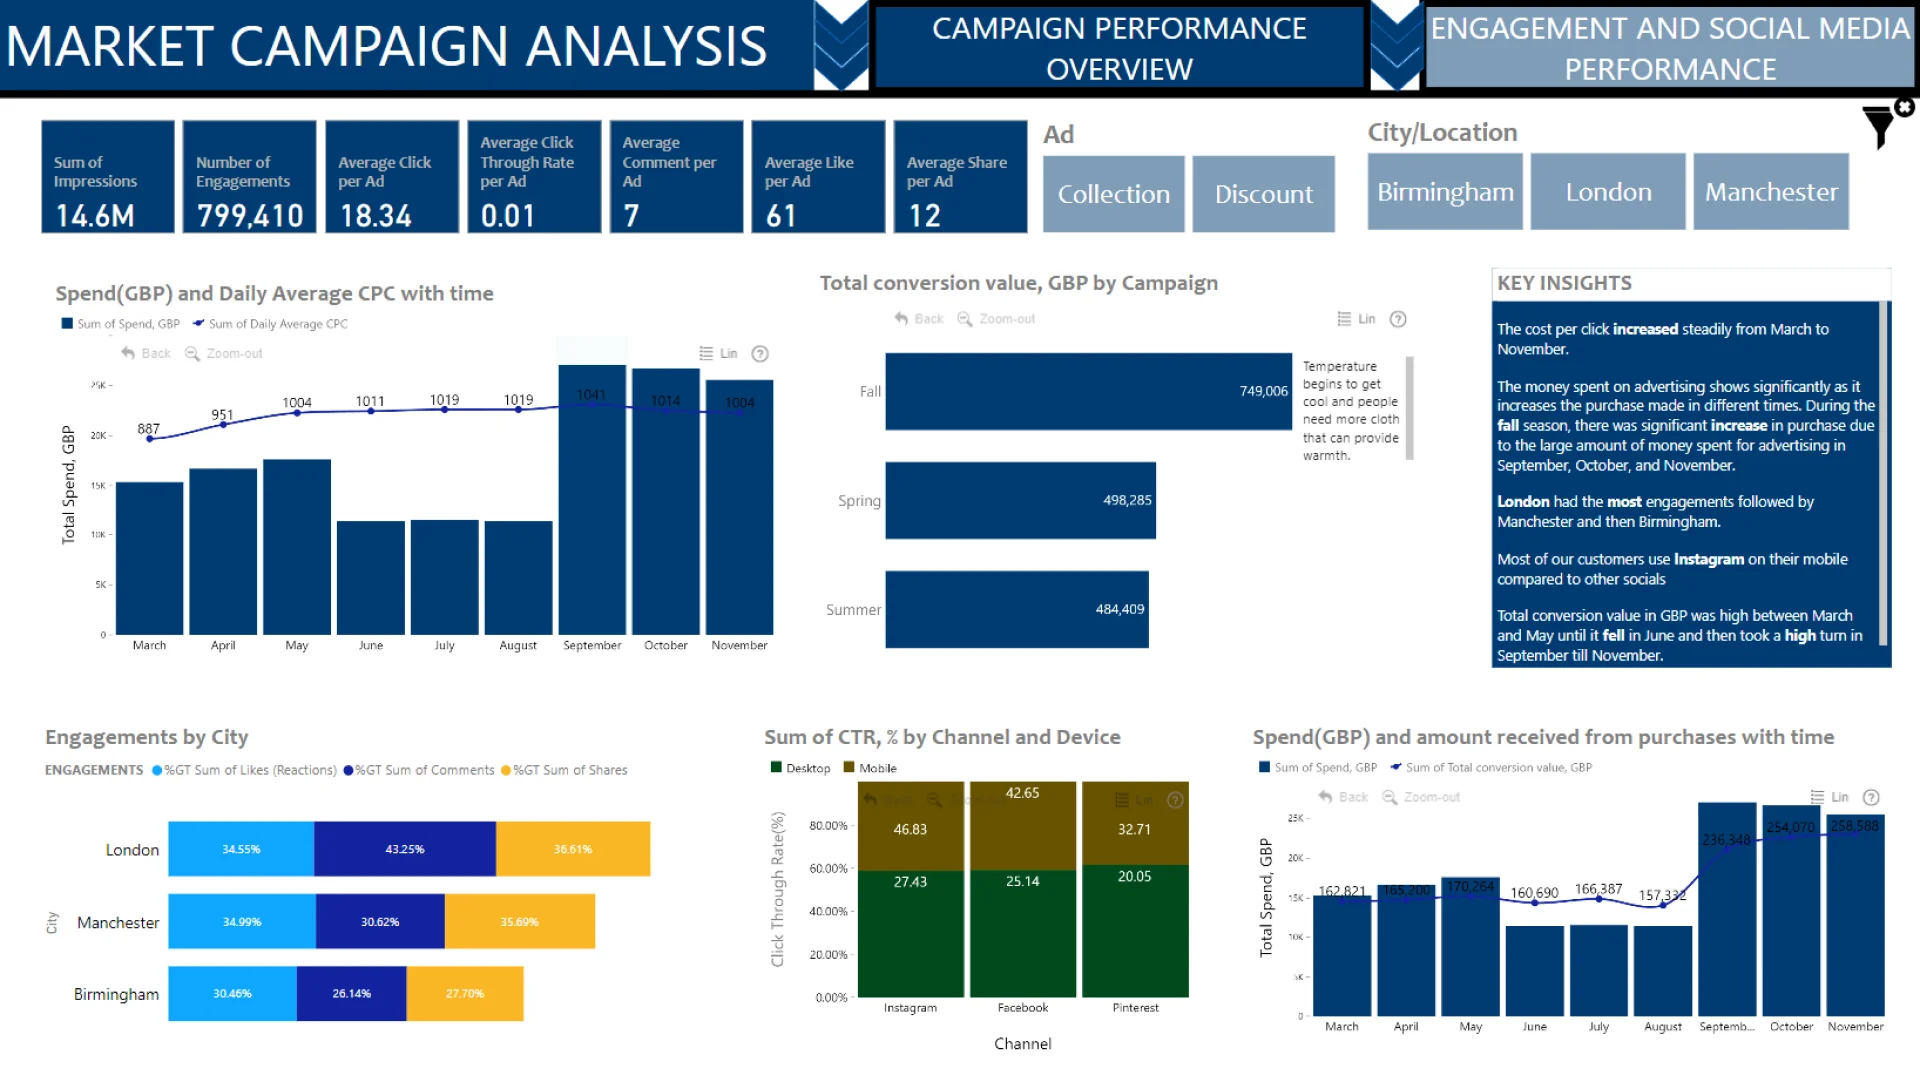
Report submitted for OnyxData #DataDNA and ZoomCharts Challenge June 2024. The report was built with the Marketing Campaing Dataset and includes ZoomCharts custom Drill Down PRO visuals for Power BI.
Author's description:
The visual presents the marketing analysis of a UK clothing store during different seasons in London, Manchester, and Birmingham.
Mobile view allows you to interact with the report. To Download the template please switch to desktop view.
