Feel free to leave your vote:
0
Share template with others
Summary
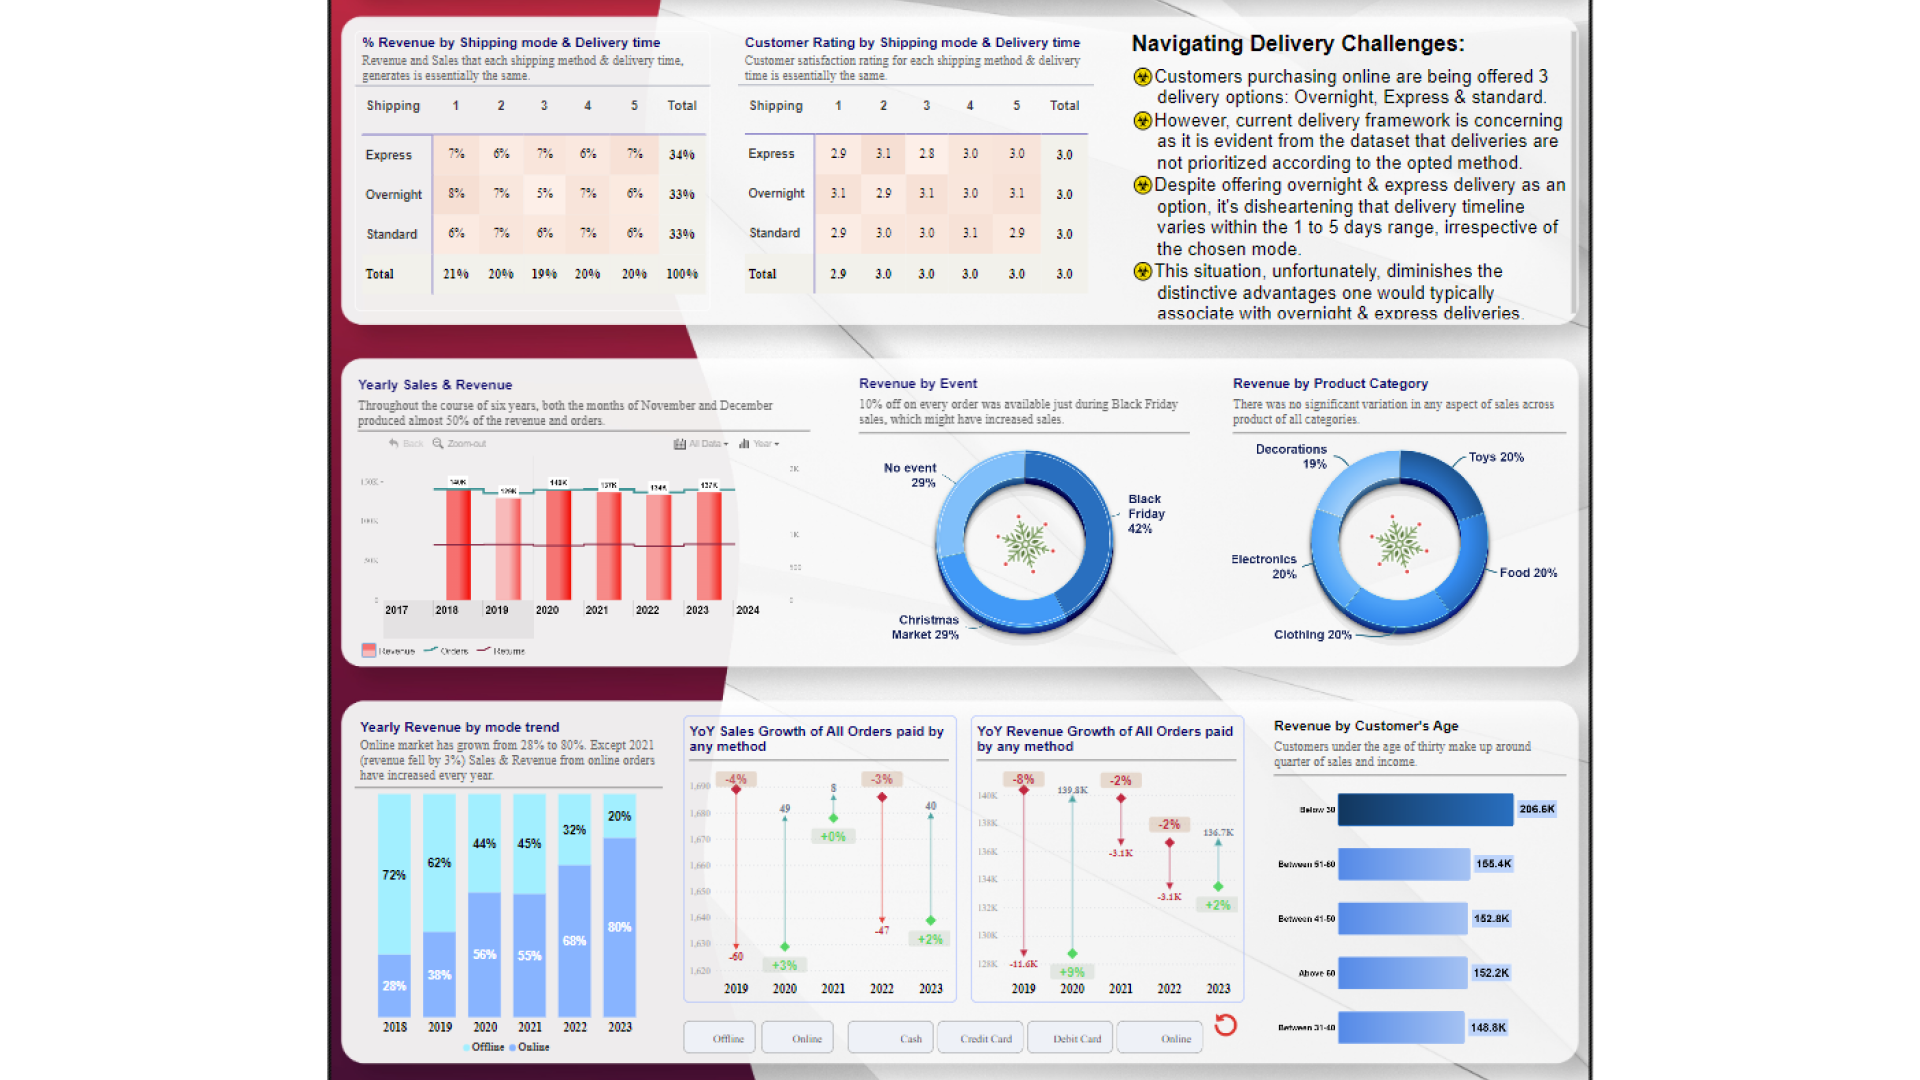
Report submitted for Onyx Data DataDNA ZoomCharts Mini Challenge, December 2023. The report was built based on Christmas Sales and Trends dataset and includes ZoomCharts custom Drill Down PRO visuals for Power BI.
Author's description:
"As the holiday spirit fills the air, I'm thrilled to share my Power BI report using ZoomCharts that delves deep into Christmas sales and trend analysis. 🎁✨. 📈 While the joy of holiday sales is undeniable, this report doesn't shy away from shedding light on the challenges. 🤔 Surprisingly, during the past six years, 50% of orders have been returned. A data-driven investigation reveals important insights underlying this pattern. From product quality concerns to customer expectations not met, understanding the 'why' gives empowerment to improve. 📦🚫 Additionally, this report unveils the impact of a not-so-jolly delivery infrastructure and suggest ways to navigate delays and hiccups, while emphasizing on the importance of streamlining the delivery processes to ensure a seamless customer experience in the upcoming year. 🚚✨ So spread the holiday cheer by checking out the Power BI report ! 🎉📊"
Mobile view allows you to interact with the report. To Download the template please switch to desktop view.
