Feel free to leave your vote:
0
Share template with others
Summary
Report submitted for the FP20 Analytics ZoomCharts Challenge, January 2025. The report was built using the Airline Delays Dataset and includes ZoomCharts custom Drill Down PRO visuals for Power BI.
Author's description:
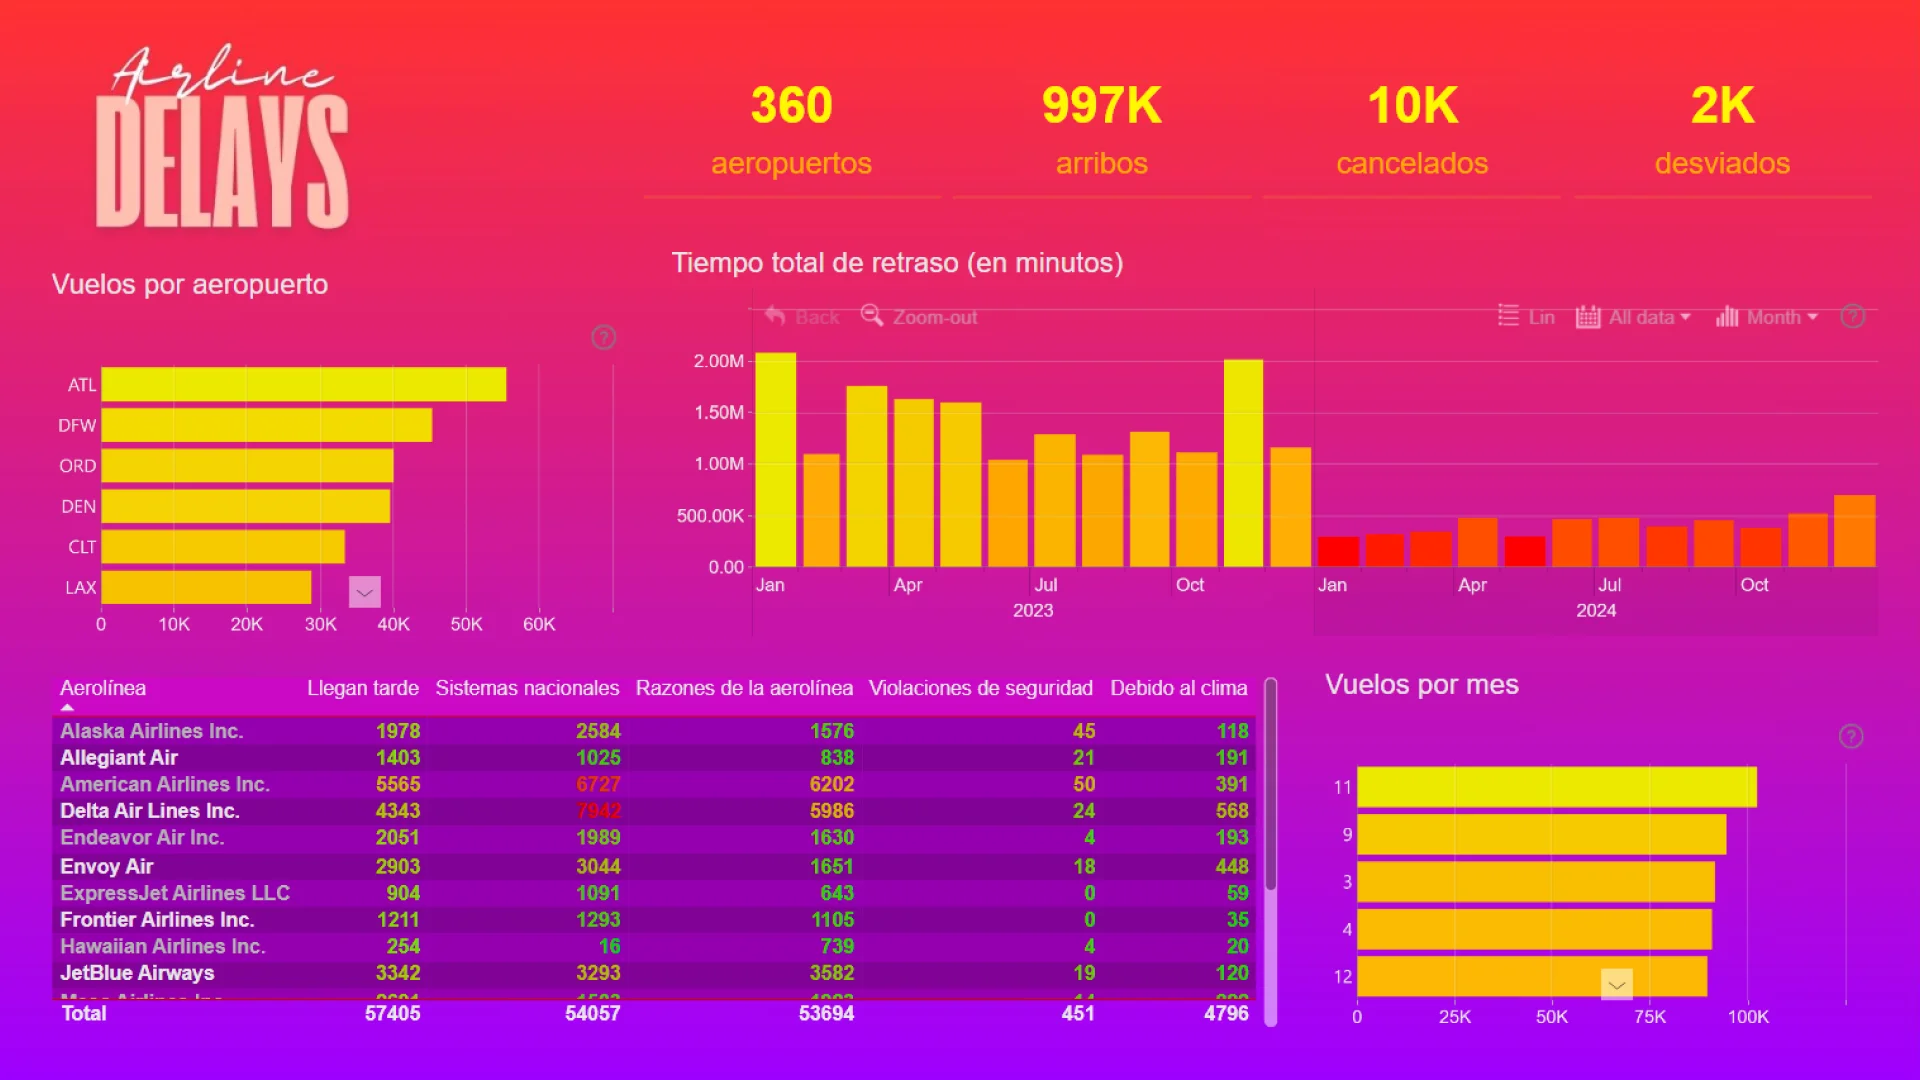
Este dashboard proporciona una visión detallada sobre los retrasos de vuelos en diferentes aeropuertos y aerolíneas. Se analizan las principales causas, tendencias mensuales y el impacto en el servicio aéreo.
ZoomCharts visuals used
Mobile view allows you to interact with the report. To Download the template please switch to desktop view.