Feel free to leave your vote:
1
Share template with others
Summary
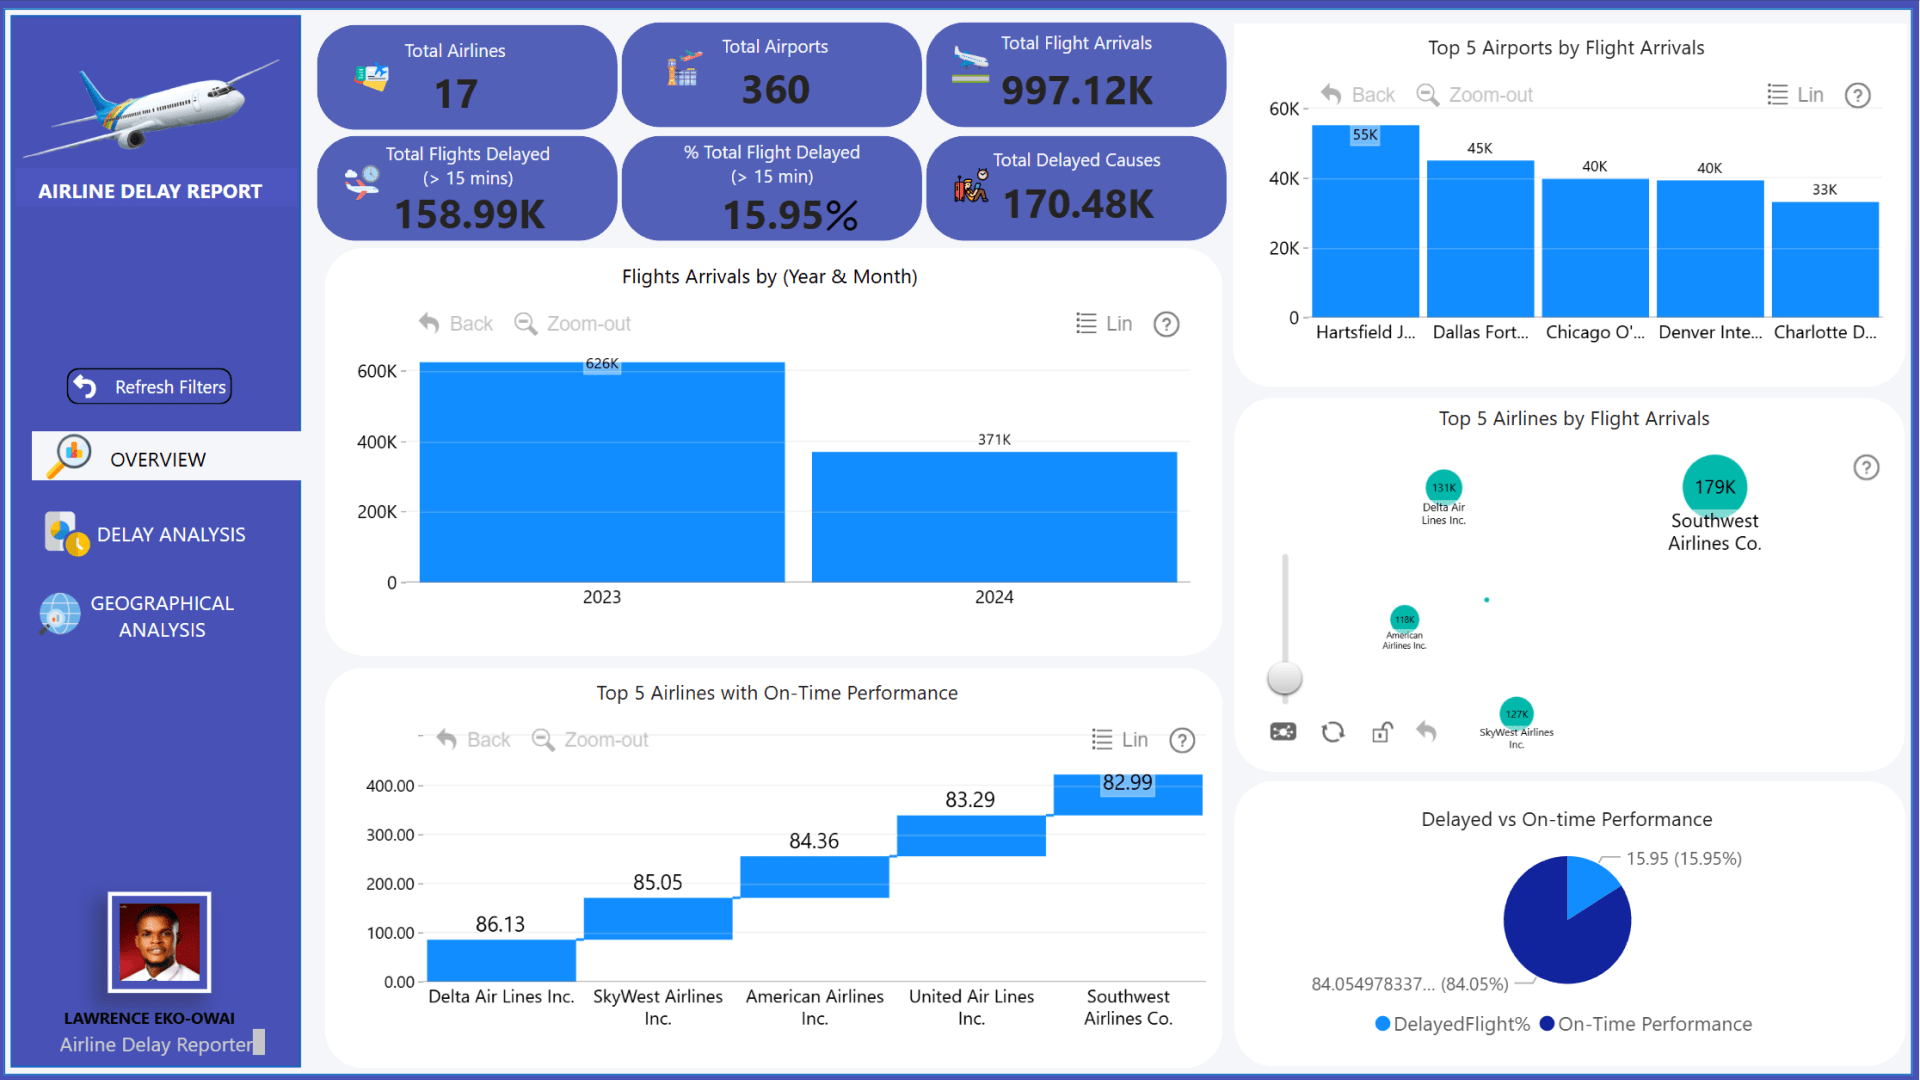
Report submitted for the FP20 Analytics ZoomCharts Challenge, January 2025. The report was built using the Airline Delays Dataset and includes ZoomCharts custom Drill Down PRO visuals for Power BI.
Author's description:
My Airline Delay Report is an interactive Power BI dashboard built for the ZoomCharts Power BI Challenge. It analyzes flight delays, causes, trends, and geographical patterns using drill-down visuals. Key insights include peak vs. off-peak season delays, top delay causes (late aircraft, weather, carrier issues), and high-delay airports. The report helps identify patterns and optimize flight scheduling for better performance. 🚀📊 #PowerBI #DataAnalytics
ZoomCharts visuals used
Mobile view allows you to interact with the report. To Download the template please switch to desktop view.