Feel free to leave your vote:
7
Share template with others
Summary
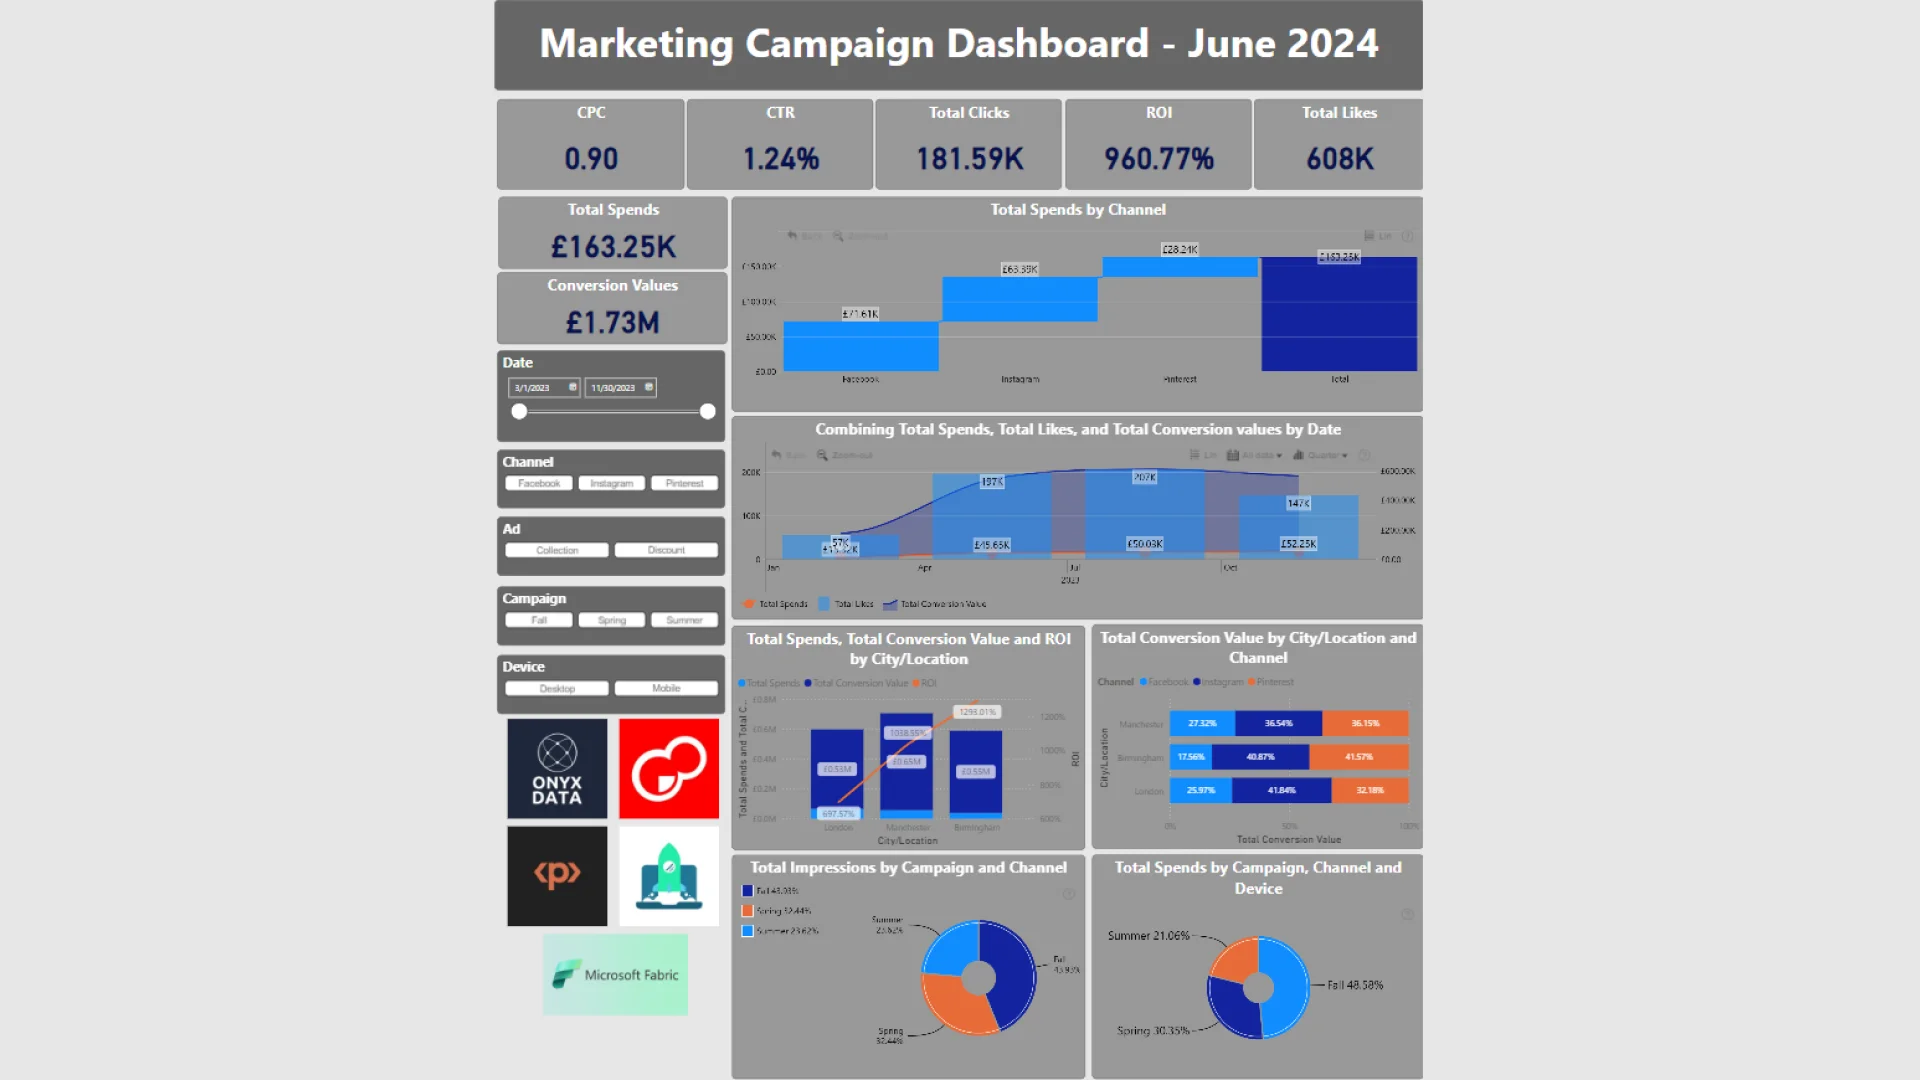
Report submitted for OnyxData #DataDNA and ZoomCharts Challenge June 2024. The report was built with the Marketing Campaing Dataset and includes ZoomCharts custom Drill Down PRO visuals for Power BI.
Author's description:
Exciting news! I'm thrilled to share the latest insights from our marketing campaign dashboard, which has been instrumental in driving our strategic decisions and optimizing performance. Our new dashboard highlights key performance indicators (KPIs) and provides a comprehensive view of our campaign’s impact across various dimensions. Here’s a closer look at what we’re tracking:
Key Performance Indicators:
- Total Spends: Monitors overall budget allocation to ensure strategic investment.
- Total Conversion Values: Measures the value generated from conversions to assess campaign effectiveness.
- ROI (Return on Investment): Evaluates financial return relative to marketing costs.
- Total Likes: Provides insights into audience engagement and content interaction.
Visual Insights:
- Total Spends By Channel: Breaks down investments across channels to align with strategic goals.
- Total Spends By Campaign: Analyzes campaign-specific spends for efficiency and effectiveness.
- Channel and Device Performance: Optimizes content across platforms based on device-specific performance.
- Combined Analysis Over Time: Tracks spends, conversion values, and likes to gauge temporal trends.
- Geographic Insights: Evaluates regional performance to tailor strategies for maximum impact.
- Location and Channel Conversion Analysis: Identifies high-value conversion areas by combining location and channel data.
I've utilized multiple ZoomCharts in this report, allowing us to drill down into charts for detailed analysis.
Mobile view allows you to interact with the report. To Download the template please switch to desktop view.
