Feel free to leave your vote:
0
Share template with others
Summary
Report submitted for Onyx Data DataDNA ZoomCharts Mini Challenge, January 2025. The report is based on the Merchandise Sales dataset and includes ZoomCharts custom Drill Down PRO visuals for Power BI.
Author's description:
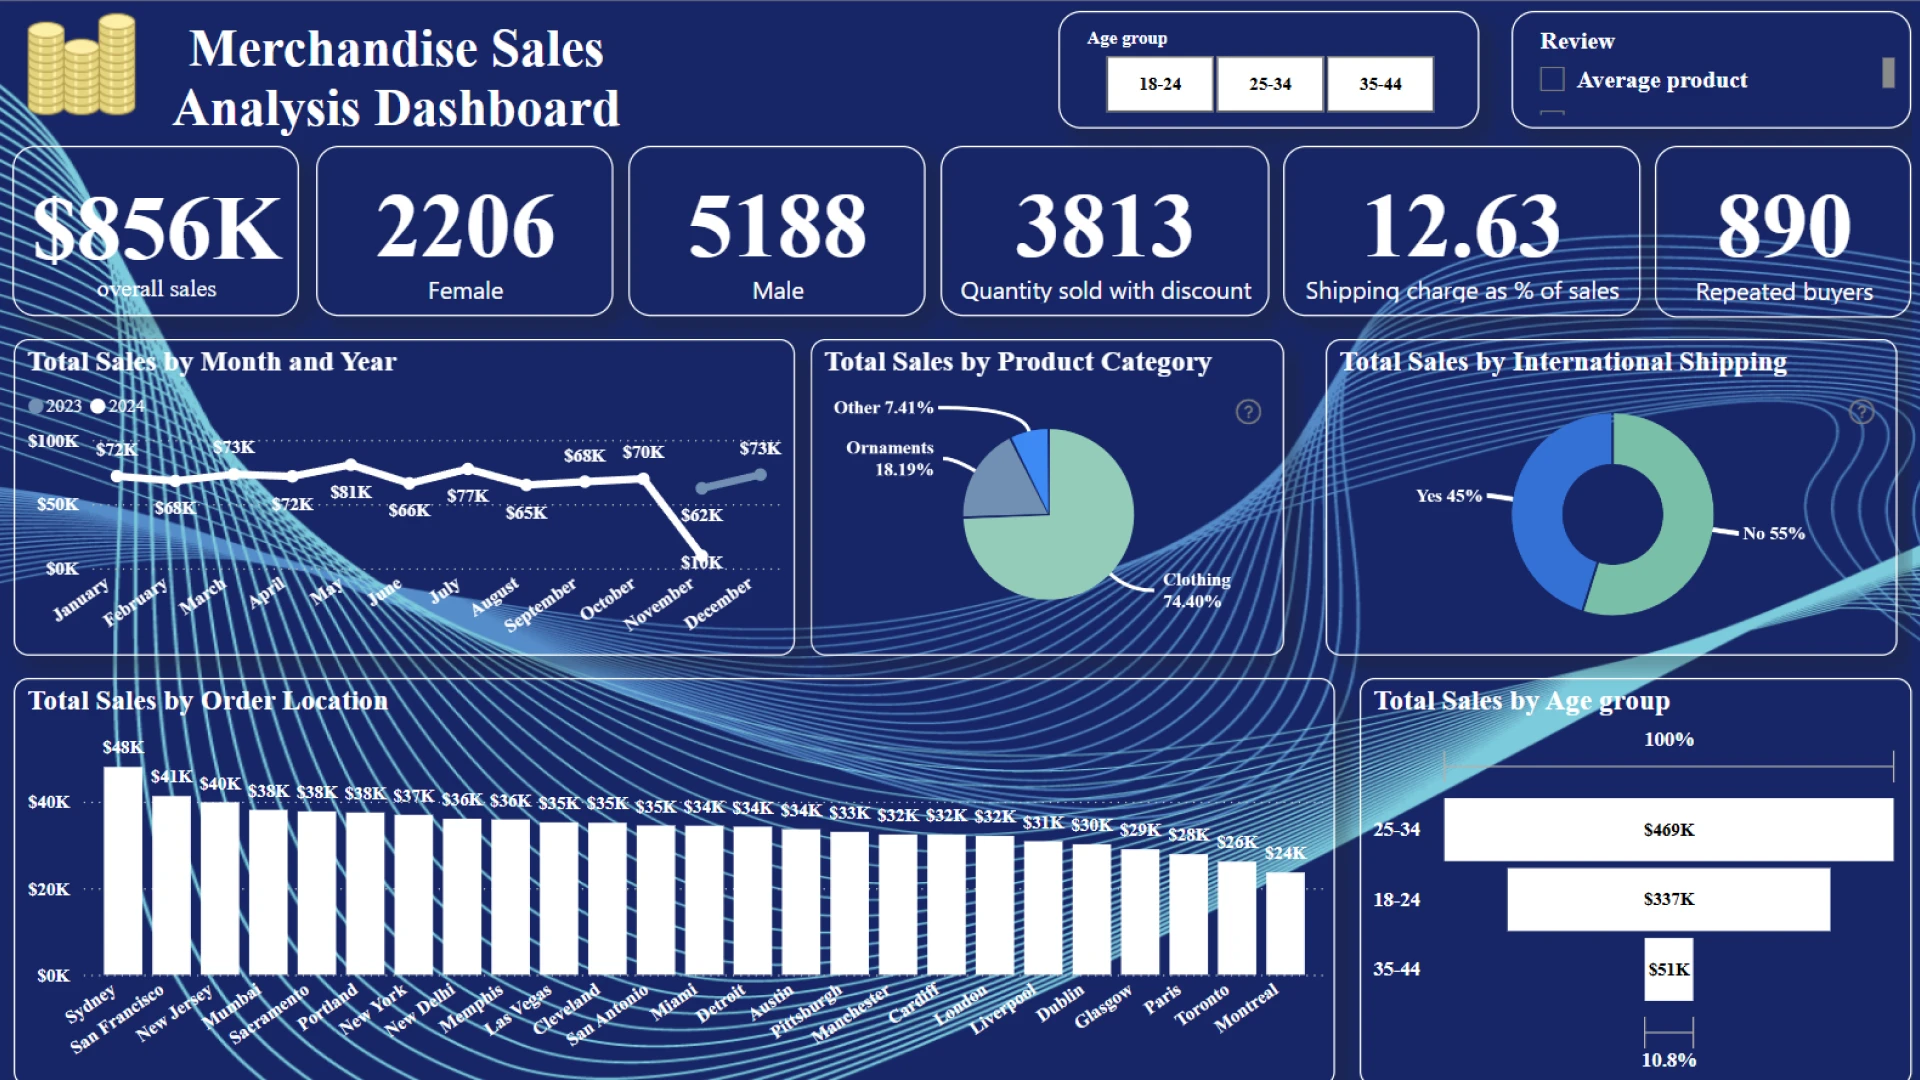
This dashboard provides an overview of merchandise sales performance, enabling users to track key metrics such as overall sales, product performance, shipping performance, repeated buyer and ratings. The dashboard features interactive visualizations, including:
1) The line chart illustrating monthly sales and shipping trends.
2) The bar chart showing sales made from different locations.
3) The pie chart displaying gender, products and international shipping distribution.
4) The scattered plot showing the different correlations between average rating, sales, price and quantity.
Mobile view allows you to interact with the report. To Download the template please switch to desktop view.