Feel free to leave your vote:
0
Share template with others
Summary
Report submitted for FP20 Analytics ZoomCharts Challenge 18 (August 2024). The report was built with the Mobile Game Analysis dataset and includes ZoomCharts custom Drill Down PRO visuals for Power BI.
Author's description:
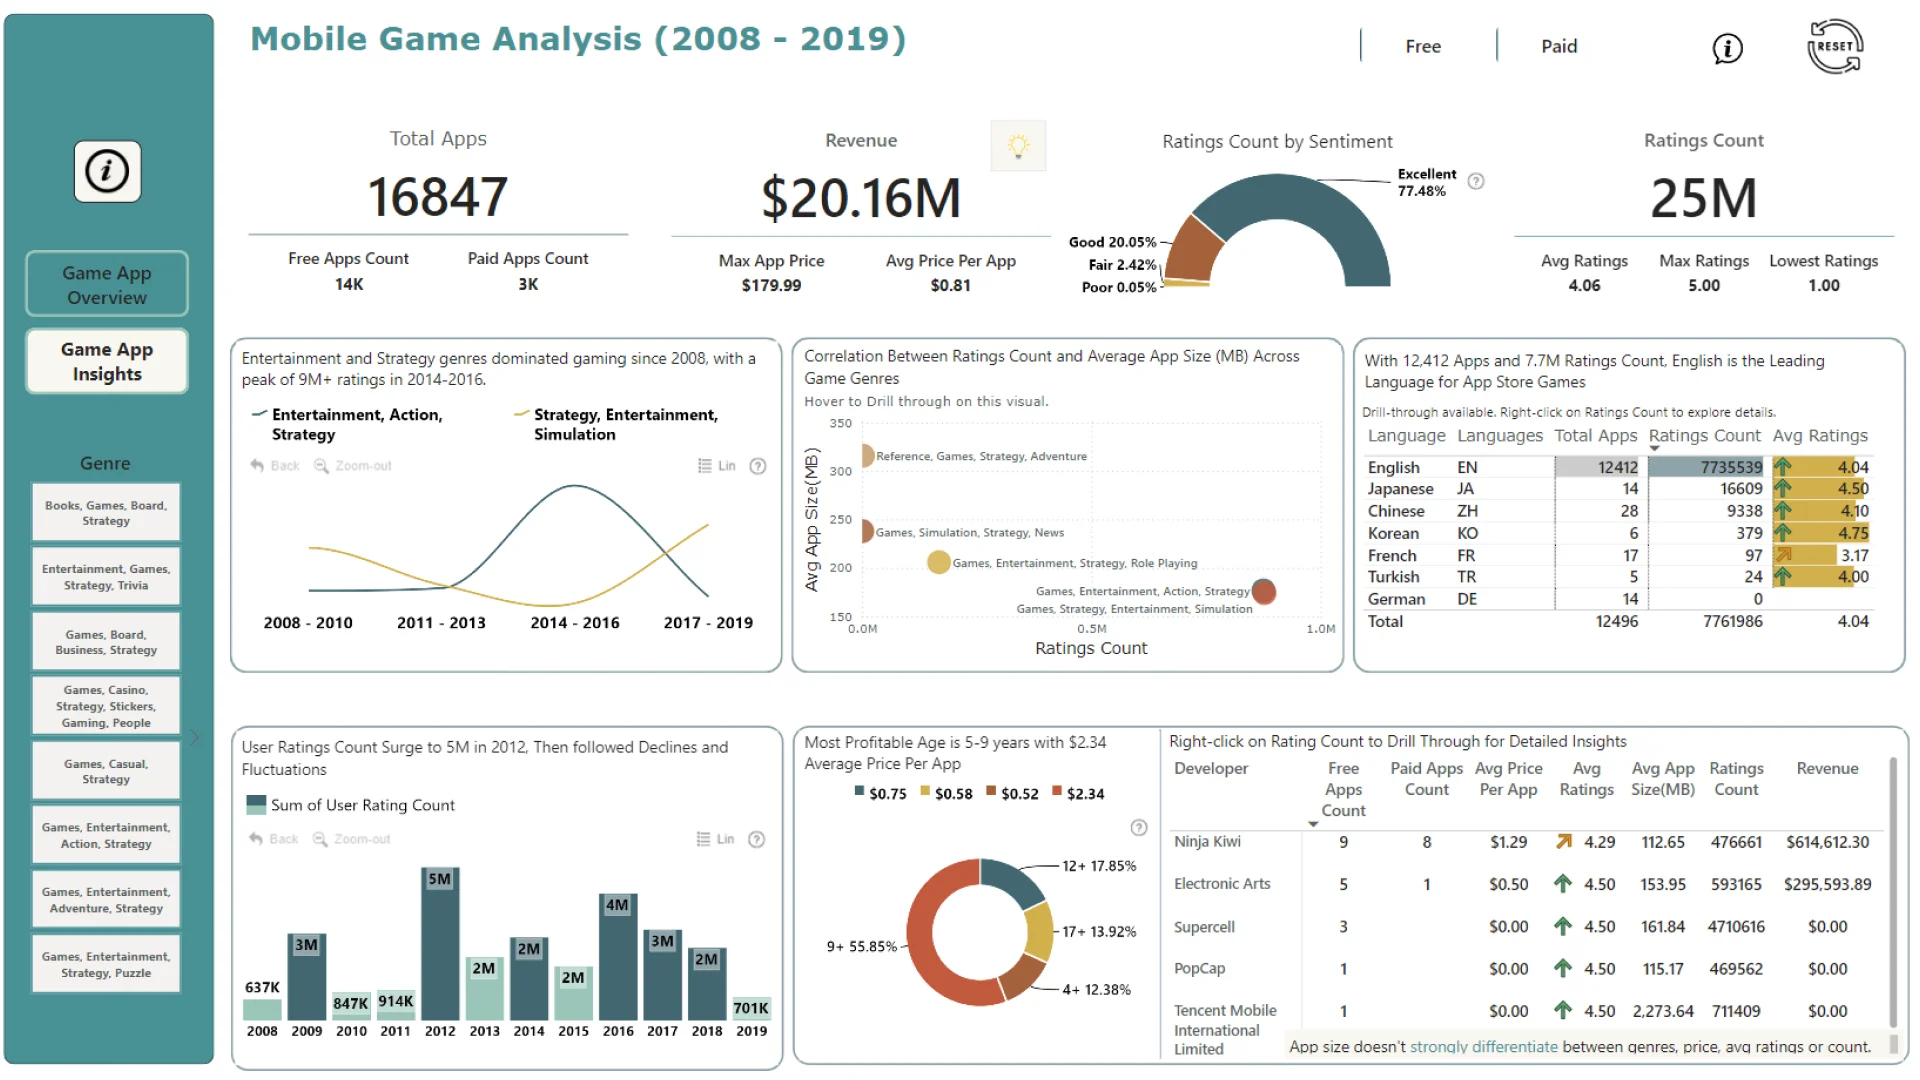
This analysis explores key trends in the App Store from 2008 to 2019, examining popular games, developer performance, revenue, ratings, pricing, language, genres, and app size.
Key Findings:
Popular Games: Clash of Clans, led by Supercell, dominated the top 5 most popular games with over 3M user ratings.
Developer Performance: Ninja Kiwi had the highest average rating across 17 apps, with 477k user ratings. Astontek Inc generated the highest estimated revenue ($3.3M) in 2013.
Revenue and Ratings: Average ratings increased over time, peaking at 4.32 in 2019. Average game prices peaked in 2016 at $2.21 before declining.
Language and Genre: English was the dominant language, and Entertainment and Strategy were the most popular genres.
Recommendations: New developers should consider starting with a free version in popular genres like Entertainment, Strategy, Action, or Simulation, and price their apps competitively (around $1).
Mobile view allows you to interact with the report. To Download the template please switch to desktop view.