Feel free to leave your vote:
0
Share template with others
Summary
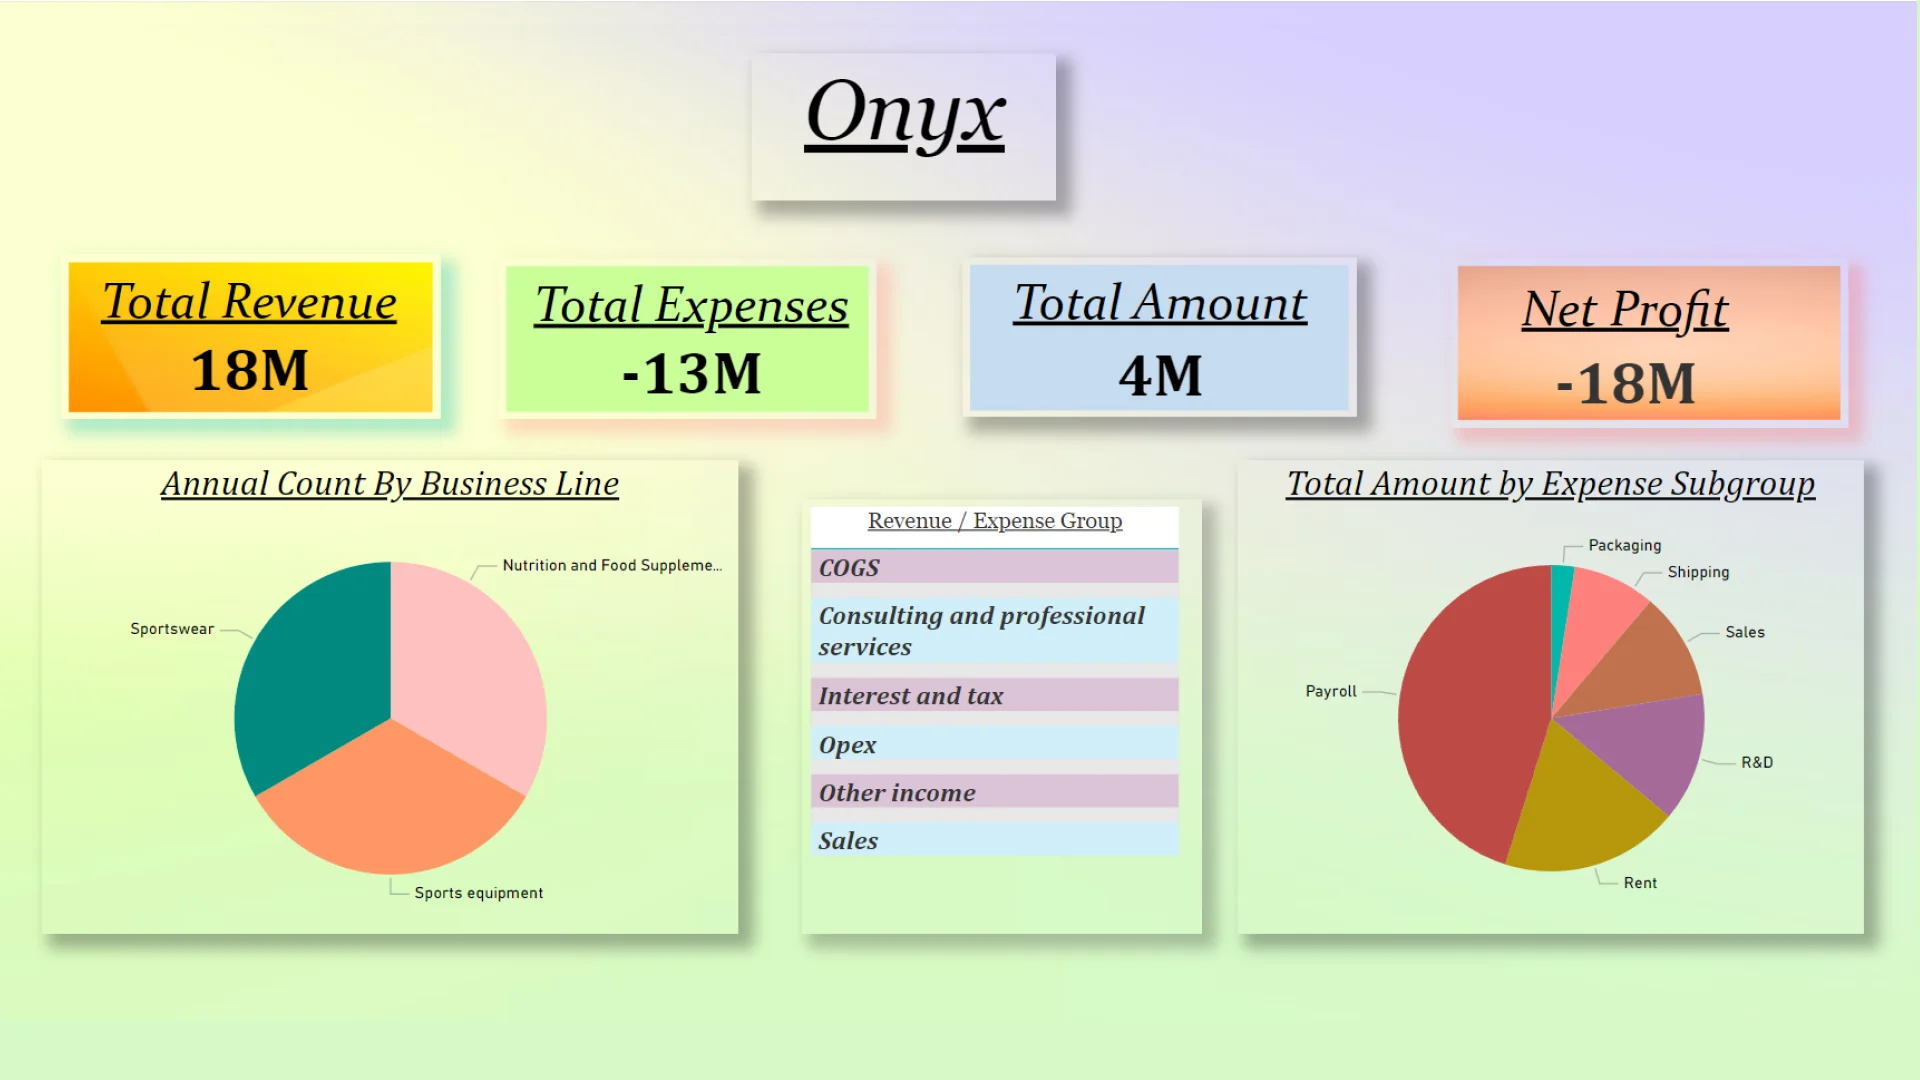
Report submitted for Onyx Data DataDNA ZoomCharts Mini Challenge, August 2024. The report was built based on Fitness Company Finance Dataset and includes ZoomCharts custom Drill Down PRO visuals for Power BI.
Author's description:
This Onyx dashboard is designed to provide a comprehensive view of the company’s financial performance and business operations over time. The dashboard includes the following metrics:
- Year: Allows users to filter and analyze data by specific years to track yearly trends and performance.
- Month Name: Provides a breakdown of financial and operational data by month for a more detailed monthly analysis.
- Month Sequence: Enables chronological tracking and comparison of performance across months.
- Date: Offers a granular view of daily activities and transactions, aiding in detailed analysis and decision-making.
- Business Line: Categorizes data by business line, allowing for the assessment of performance and profitability across different areas of the business.
- Amount: Displays the total amounts for revenue and expenses, helping to understand the overall financial status.
- Expense Subgroup: Breaks down expenses into specific categories, providing deeper insights into spending patterns and cost areas.
- Revenue/Expense Group: Groups data into revenue and expense categories, facilitating easy comparison and analysis of financial inflows and outflows.
- Revenue or Expense: Distinguishes between revenue and expenses, providing clarity on financial contributions and costs.
This dashboard allows users to dynamically analyze financial data, identify trends, and make informed decisions to enhance business performance.
Mobile view allows you to interact with the report. To Download the template please switch to desktop view.
