Feel free to leave your vote:
5
Share template with others
Summary
Report submitted for OnyxData #DataDNA and ZoomCharts Challenge June 2024. The report was built with the Marketing Campaing Dataset and includes ZoomCharts custom Drill Down PRO visuals for Power BI.
Author's description:
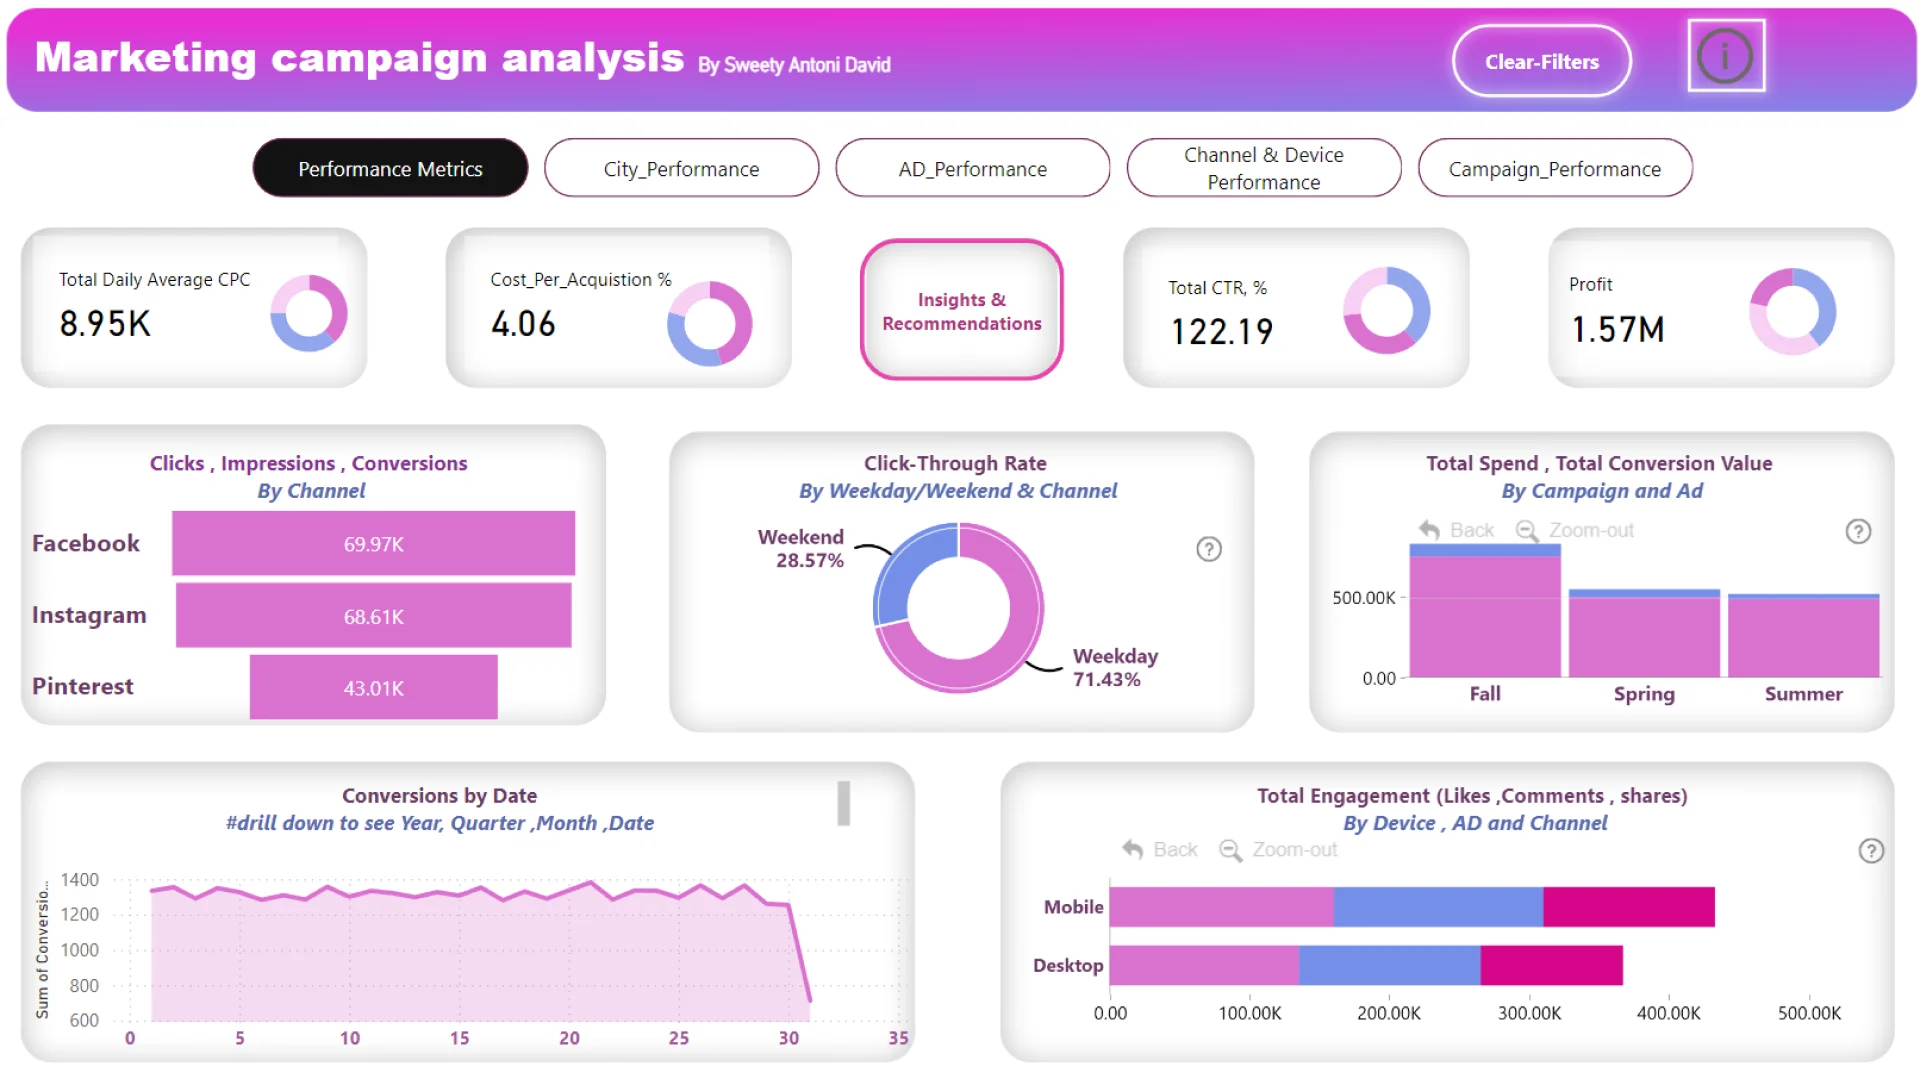
Optimize advertising spend by increasing the Pinterest budget for cost-effective conversions and refining Facebook ads to improve CPA. Enhance the mobile user experience to boost conversions. Tailor Instagram content for high engagement and use Facebook for broad reach campaigns. Monitor performance metrics regularly for data-driven adjustments.
Key Metrics:
-
Total Spend and Conversion Value:
- Fall: $79.31K spent, $749.01K conversion.
- Spring: $49.55K spent, $498.29K conversion.
- Summer: $34.38K spent, $484.41K conversion.
-
Total Engagement (Likes, Shares, Comments):
- Pinterest: Fall (83.70K), Spring (59.97K), Summer (80.63K).
- Instagram: Fall (101.33K), Spring (81.67K), Summer (96.51K).
- Facebook: Fall (106.40K), Spring (91.81K), Summer (97.28K).
-
Cost Per Acquisition (CPA):
- Fall: 5.55%.
- Spring: 3.93%.
- Summer: 2.70%.
-
Click-Through Rate (CTR):
- Collection Campaigns: 66.29%.
- Discount Campaigns: 55.89%.
Focus on high-engagement channels, especially Facebook and Instagram, and ensure ads are optimized for both mobile and desktop. The total profit achieved is $1.57K, with a daily average CPC of $8.95 and a cumulative CTR of 122.19%.
ZoomCharts visuals used
Mobile view allows you to interact with the report. To Download the template please switch to desktop view.