Feel free to leave your vote:
0
Share template with others
Summary
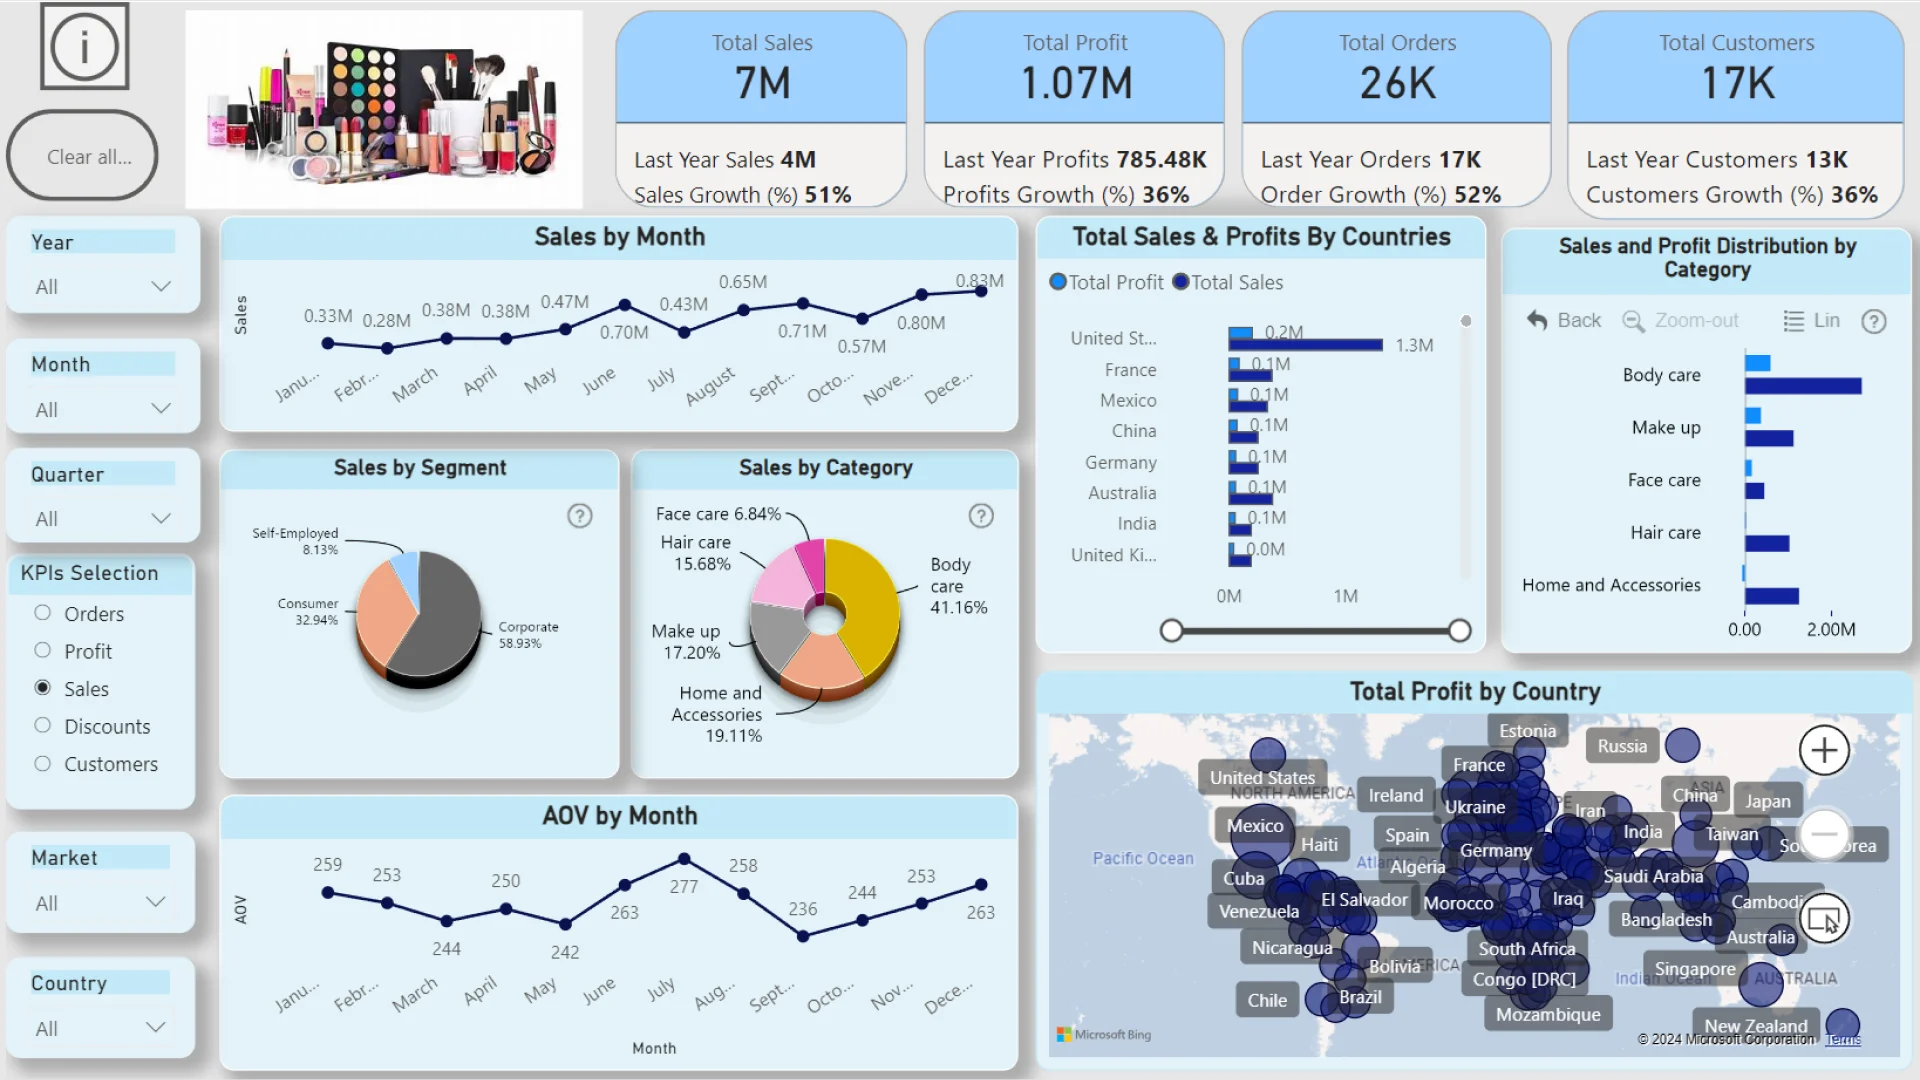
Report submitted for FP20 Analytics ZoomCharts Challenge 19 (September 2024). The report was built with the E-commerce KPI Analysis dataset and includes ZoomCharts custom Drill Down PRO visuals for Power BI.
Author's description:
This dashboard provides a comprehensive analysis of sales volumes and profitability across various product groups and markets, with a focus on key performance indicators (KPIs) essential to the success of the e-store. The dashboard is designed to help the business achieve specific targets, including an annual profit margin of 36%, 51% annual overall sales growth (with a higher target of 59% for the corporate segment), and at least $400K in annual sales for each market.
ZoomCharts visuals used
Mobile view allows you to interact with the report. To Download the template please switch to desktop view.
