Feel free to leave your vote:
11
Share template with others
Summary
Report submitted for Onyx Data DataDNA ZoomCharts Mini Challenge, December 2023. The report was built based on Christmas Sales and Trends dataset and includes ZoomCharts custom Drill Down PRO visuals for Power BI.
Author's description:
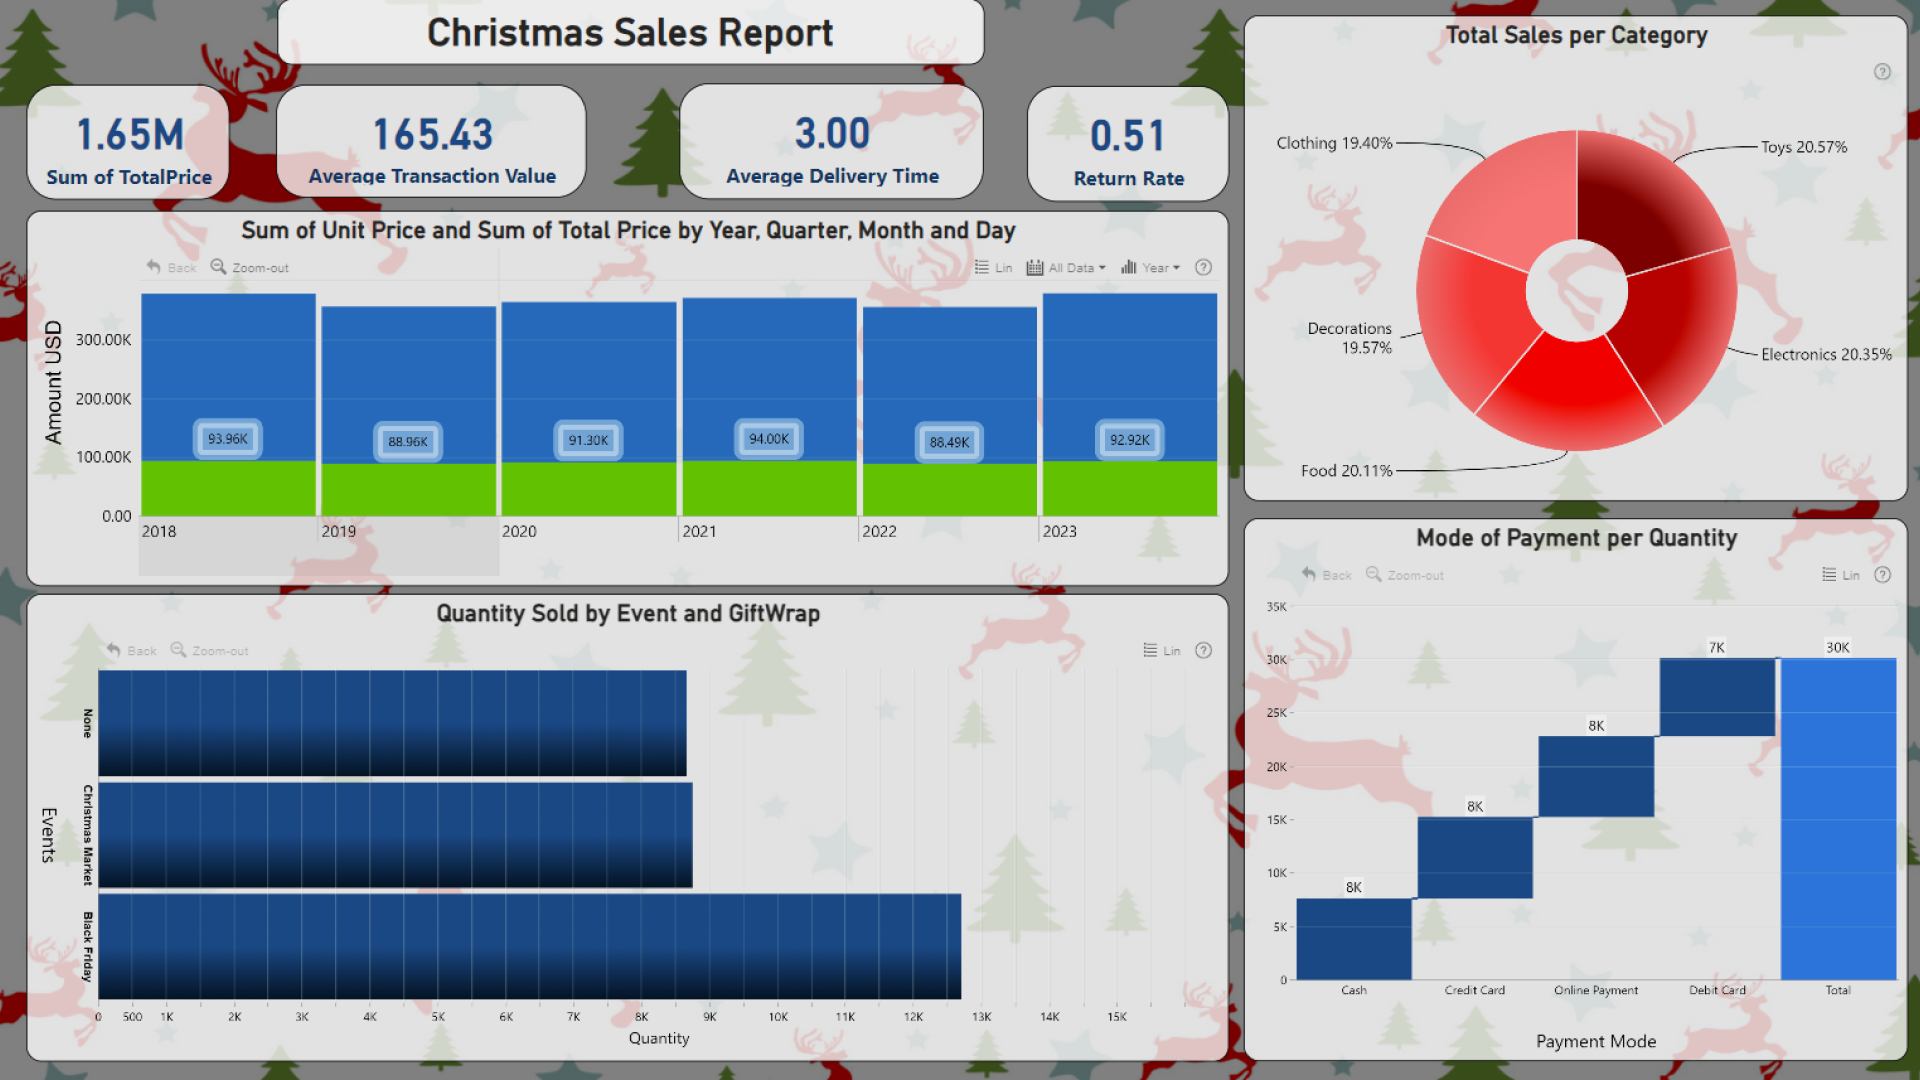
This dashboard provides a comprehensive overview of sales performance during the Christmas season, analyzing key metrics such as sales trends over years, months, and days, category-wise sales distribution, sales quantity during events with and without gift wrapping, payment methods, and essential transaction statistics.
Combo Bar Chart - Unit Sold Over Years, Months, Days: Visualization: Combo bar chart displaying the total units sold over the years, broken down by months and days. Insights: Visualizes the trend of units sold during Christmas seasons across multiple years, months within the Christmas period, and specific days showing peak sales.
Pie Chart - Total Sales per Category: Visualization: Pie chart illustrating the distribution of total sales across different product categories. Insights: Offers an overview of which product categories contribute the most to overall sales during the Christmas season.
Bar Chart - Quantity Sold by Event and Gift Wrap: Visualization: Bar chart showcasing the quantity of products sold during specific events (e.g., Christmas, Black Friday) based on whether gift wrapping was applied or not. Insights: Highlights the impact of events and gift wrapping on the quantity of items sold, providing insights into customer preferences during these events.
Waterfall Chart - Mode of Payment (Cash, Credit Card, Online Payment): Visualization: Waterfall chart presenting the mode of payment breakdown (Cash, Credit Card, Online Payment) and their contribution to total sales. Insights: Offers a visual representation of how different payment methods contribute to sales, showcasing the dominant mode of payment during the Christmas period.
Cards - Key Performance Indicators: Total Price: Displays the total revenue generated during the Christmas sales period.
Average Transaction Value: Exhibits the average value of each transaction during the Christmas season.
Average Delivery Time: Represents the average number of days taken for delivery during Christmas sales.
Return Rate: Highlights the percentage of returned items in relation to total transactions during the Christmas season.
Summary: This dashboard allows stakeholders to understand the sales performance during the Christmas period, providing insights into sales trends, product categories driving revenue, the impact of events and gift wrapping on sales quantity, preferred payment methods, and key performance indicators shaping the overall sales experience. These visualizations assist in making informed decisions and developing strategies to optimize sales during festive seasons like Christmas.
ZoomCharts visuals used
Mobile view allows you to interact with the report. To Download the template please switch to desktop view.
