Feel free to leave your vote:
2
Share template with others
Summary
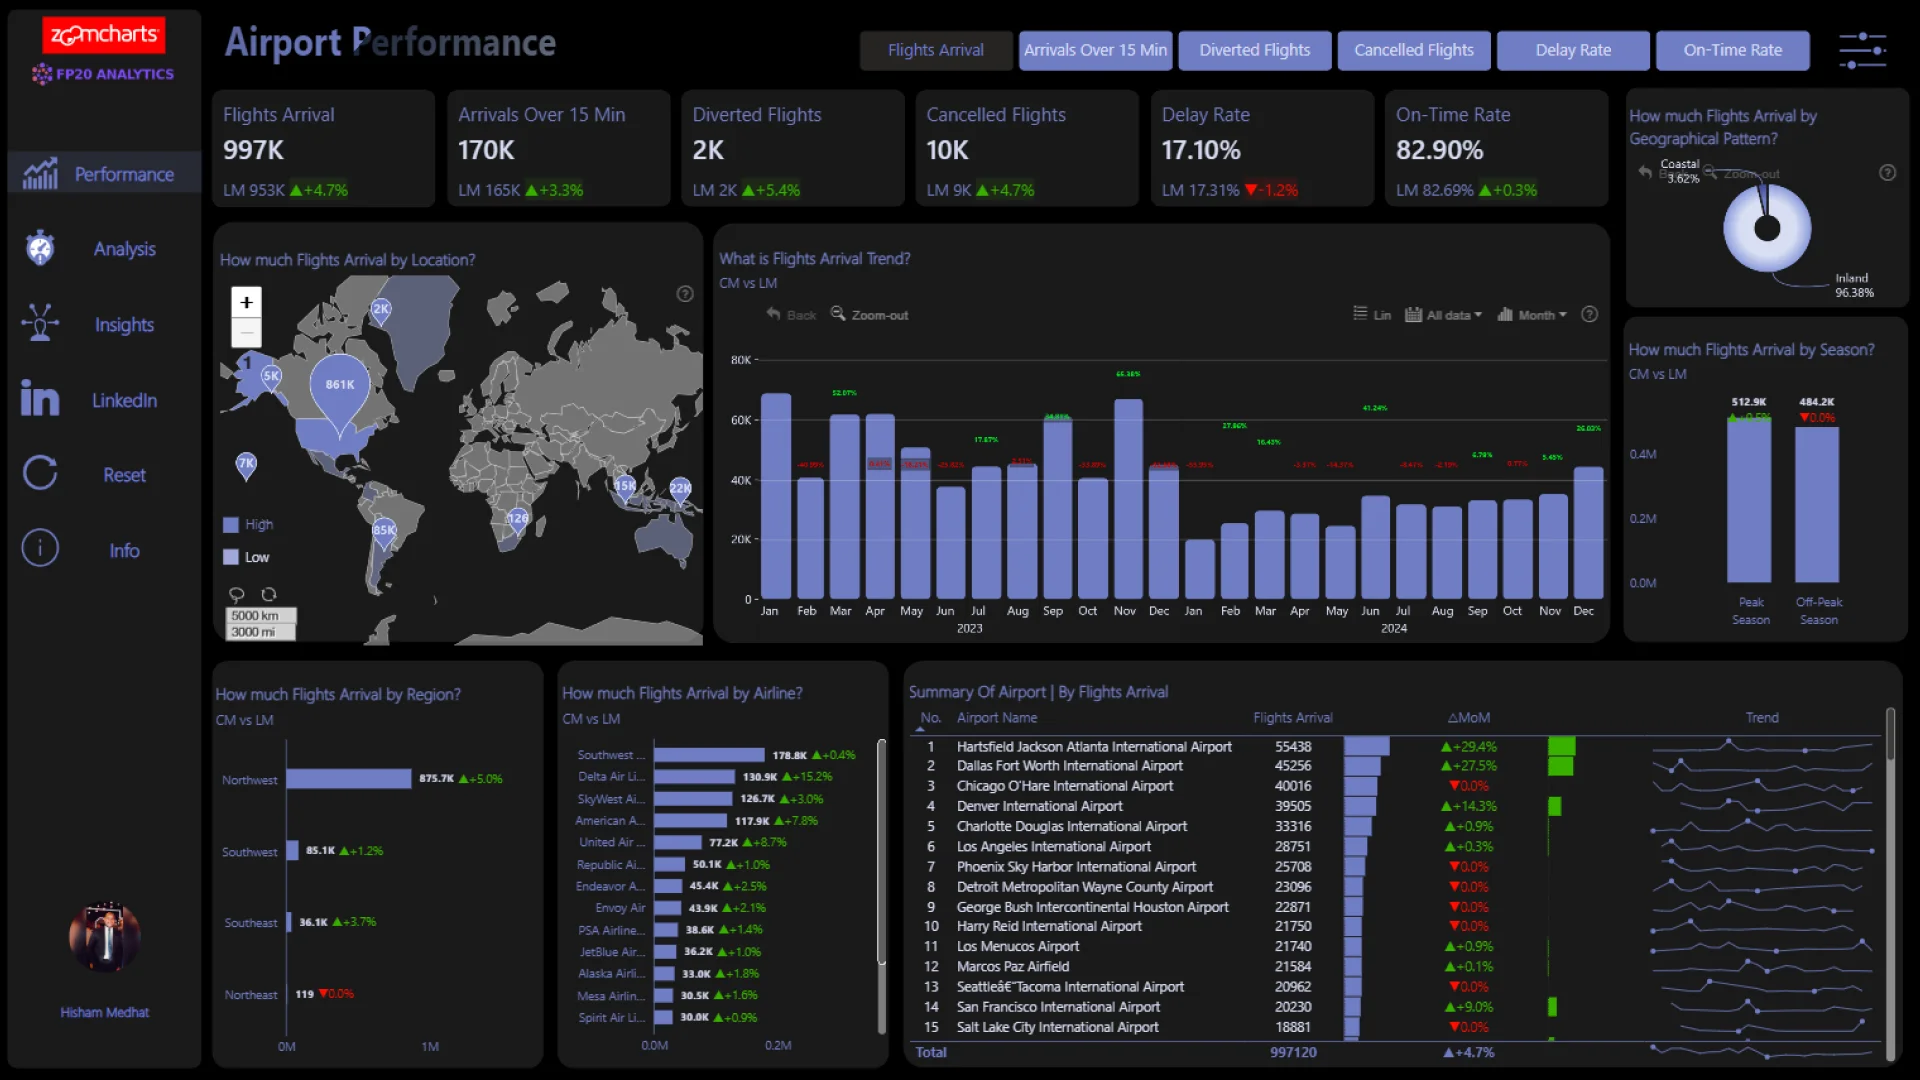
Report submitted for the FP20 Analytics ZoomCharts Challenge, January 2025. The report was built using the Airline Delays Dataset and includes ZoomCharts custom Drill Down PRO visuals for Power BI.
Author's description:
This Power BI report analyzes airline delays, providing insights into key factors affecting flight punctuality. It includes interactive visualizations on delay causes, airline performance, airport-specific trends, and seasonal variations. Users can explore metrics such as average delay times, most affected routes, and on-time performance rates, enabling data-driven decisions for optimizing airline operations and improving passenger experience.
ZoomCharts visuals used
Mobile view allows you to interact with the report. To Download the template please switch to desktop view.