Feel free to leave your vote:
6
Share template with others
Summary
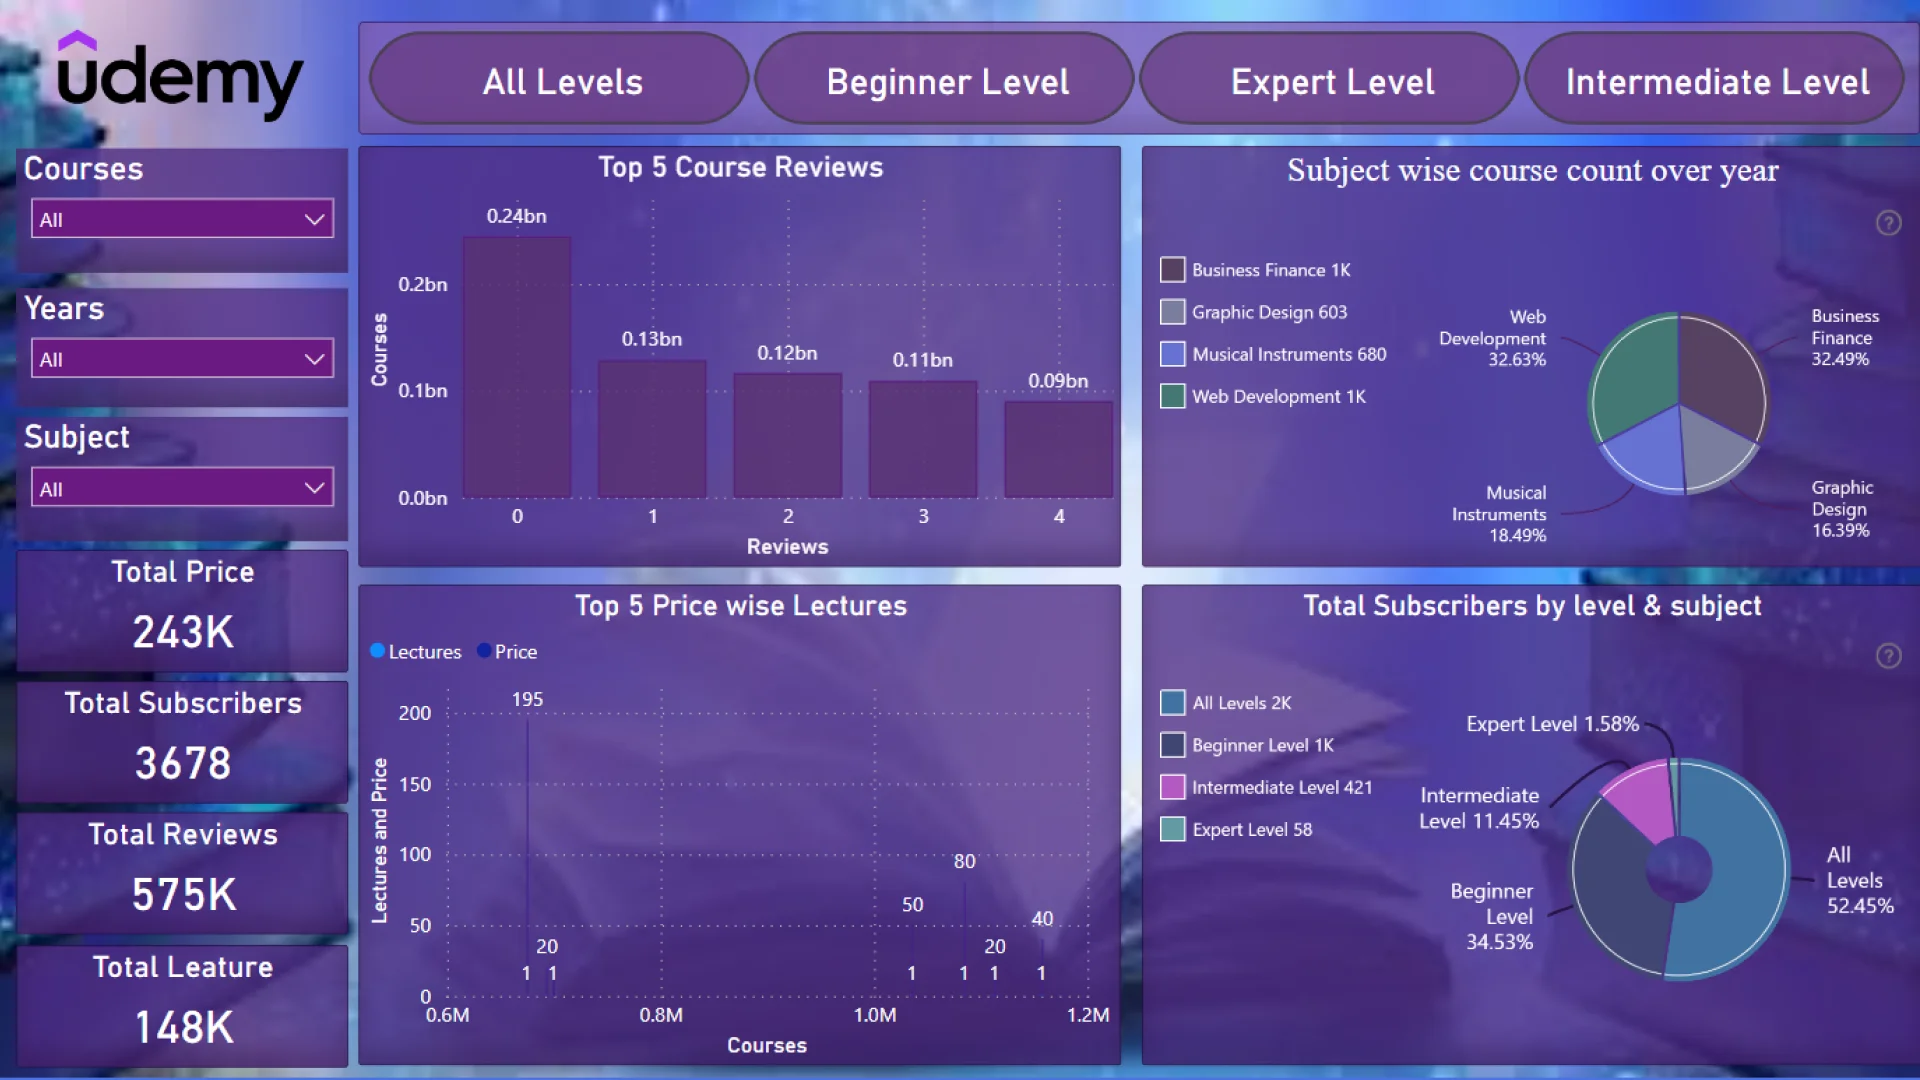
Report submitted for Onyx Data DataDNA ZoomCharts Mini Challenge, January 2024. The report was built based on Udemy Courses dataset and includes ZoomCharts custom Drill Down PRO visuals for Power BI.
Author's description:
In this Report I have used a couple of ZoomCharts visuals to show the data with insightful drill-though. I am showing the data analysis about the Udemy courses, subject, subscribers, Levels, etc. I have created multiple Measures and custom columns.
Mobile view allows you to interact with the report. To Download the template please switch to desktop view.