Feel free to leave your vote:
4
Share template with others
Summary
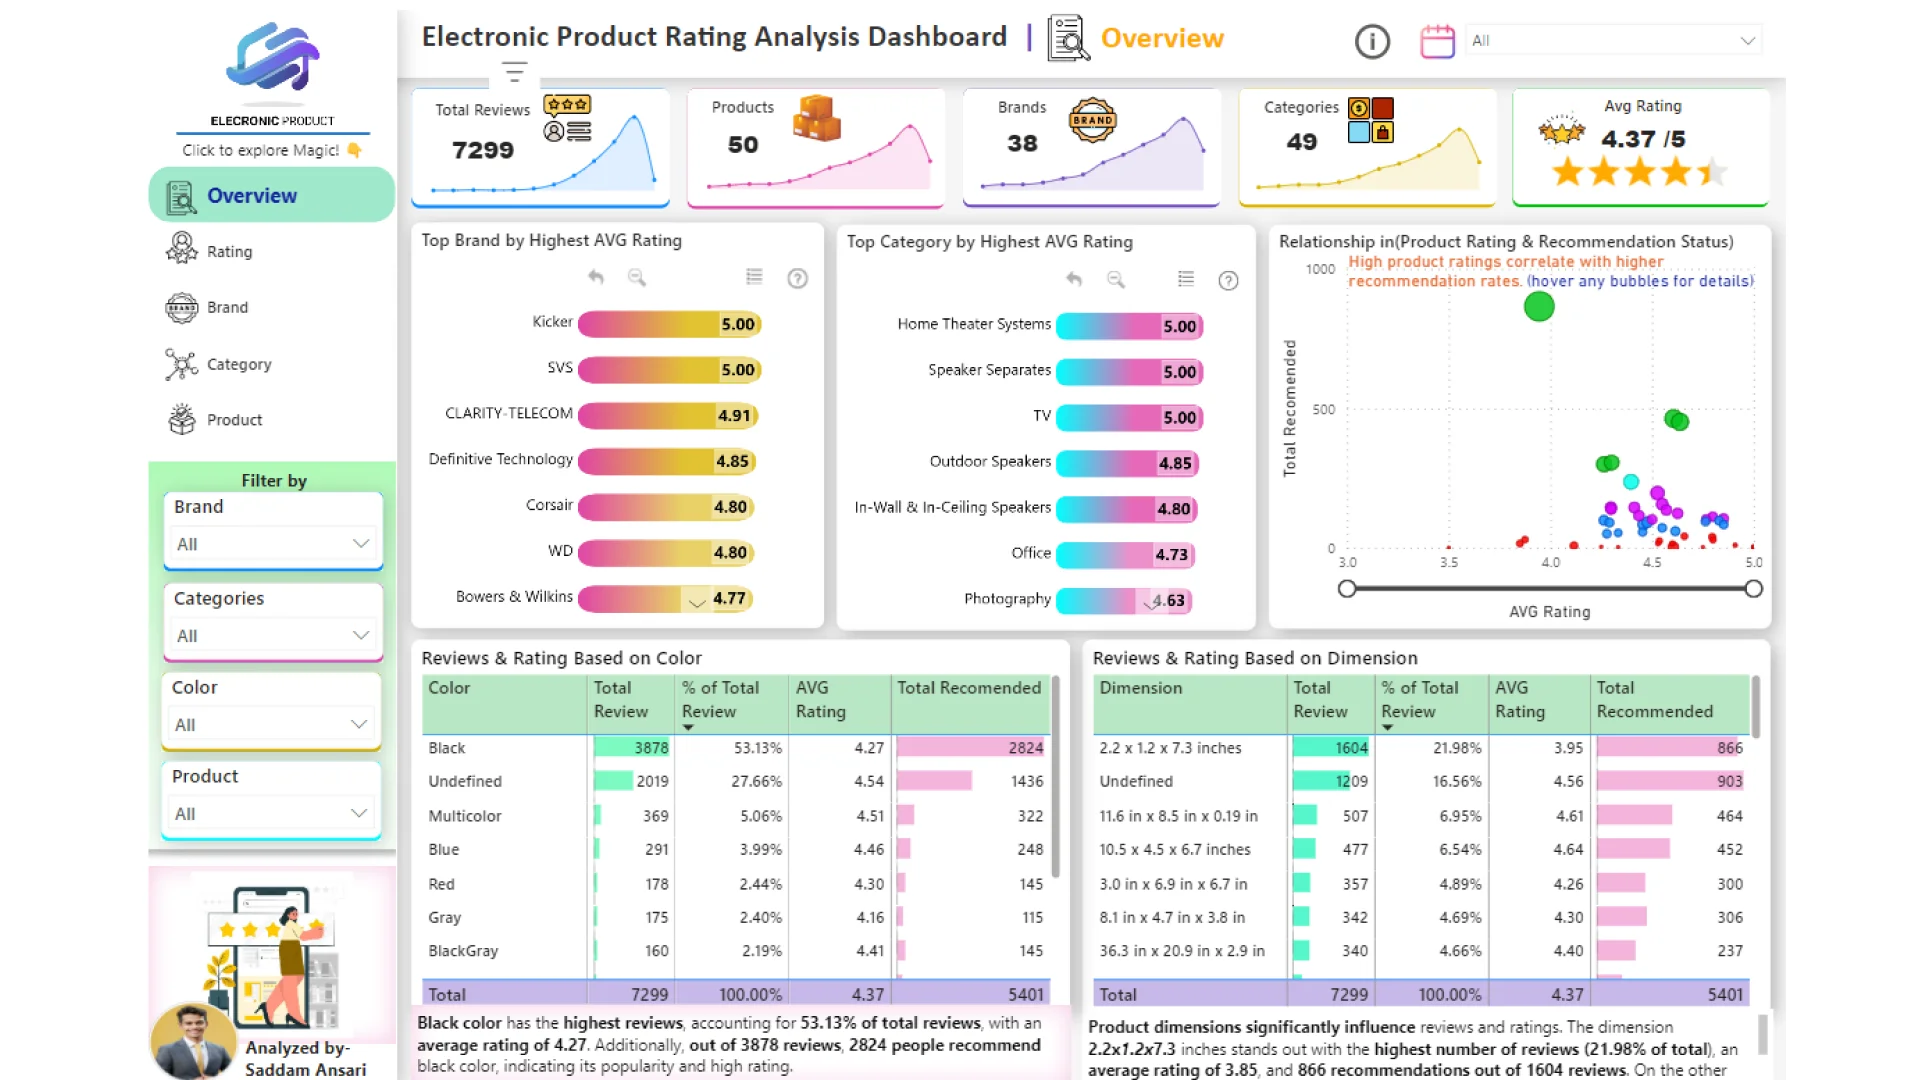
Report submitted for Onyx Data DataDNA ZoomCharts Mini Challenge, February 2024. The report was built based on Electronics Product Data Ratings dataset and includes ZoomCharts custom Drill Down PRO visuals for Power BI.
Author's description:
I participated in the Data DNA challenge sponsored by Onyx Data and ZoomCharts, focusing on analyzing electronic product reviews and ratings from 2007 to 2017 obtained from various websites. The challenge aimed to answer key questions such as the relationship between product ratings and recommendation status, identifying brands with the highest customer satisfaction, and understanding how product features influence reviews and ratings. To address these questions, I created a dashboard with visualizations and insights. I used scatter plots to illustrate the correlation between product ratings and recommendation status, demonstrating that products with higher average ratings tend to be more recommended. Additionally, I utilized ZoomCharts' drill-down combo bar pro visual to showcase the top 10 brands and categories with the highest average ratings, providing insights into customer satisfaction across different product categories.
For analyzing the influence of product features, I created separate tables displaying ratings, reviews, and recommendations based on color and dimensions, allowing for a comparison of how different features impact customer perceptions. Furthermore, I developed four additional pages for optional analysis based on ratings, brands, categories, and products, leveraging ZoomCharts' advanced visuals for deeper insights.
I'm grateful to Onyx Data for providing a platform for aspiring data analysts to work on real-time datasets and enhance their skills. Additionally, I extend my appreciation to ZoomCharts for generously offering their premium visuals, which greatly enhanced the project's presentation and analysis capabilities. I also want to express my gratitude to Aivis Pavlovs from ZoomCharts for providing valuable guidance on utilizing ZoomCharts visuals effectively.
ZoomCharts visuals used
Mobile view allows you to interact with the report. To Download the template please switch to desktop view.