Feel free to leave your vote:
9
Share template with others
Summary
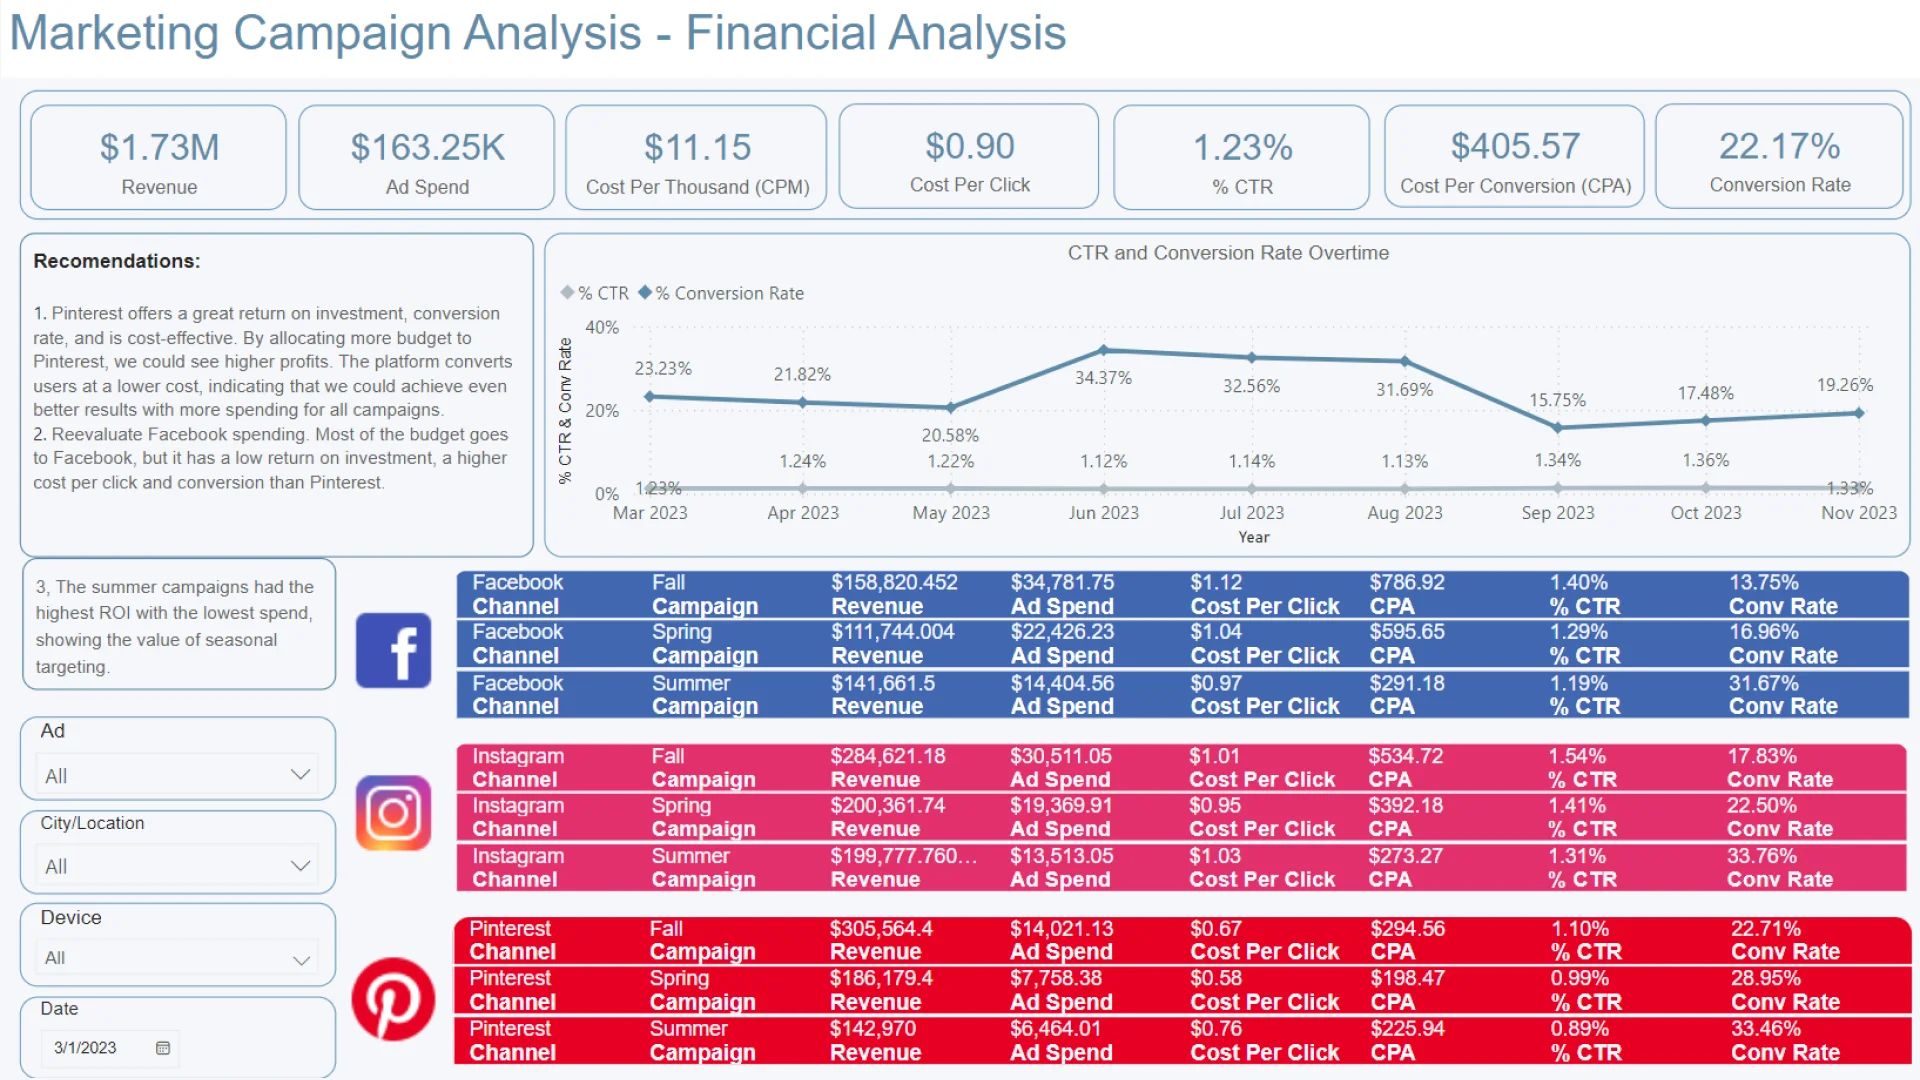
Report submitted for OnyxData #DataDNA and ZoomCharts Challenge June 2024. The report was built with the Marketing Campaing Dataset and includes ZoomCharts custom Drill Down PRO visuals for Power BI.
Author's description:
This report utilizes a Power BI dashboard to analyze the performance metrics of marketing campaigns. The dataset includes metrics such as conversion rate, conversion rates per 1000 impressions, cost per click, and cost per conversion. The primary objective is to provide valuable insights into the effectiveness of each campaign and identify opportunities for improvement.
Mobile view allows you to interact with the report. To Download the template please switch to desktop view.
