logo
For Power BI
  • Products
    • Drill Down Donut Pro Drill Down Donut PRO
    • Drill Down Pie Pro Drill Down Pie PRO
    • Drill TimeSeries Pro Drill Down TimeSeries PRO
    • Drill Combo Pro Drill Down Combo PRO
    • Drill Map Pro Drill Down Map PRO
    • Drill Scatter Pro Drill Down Scatter PRO
    • Drill Down Network Pro Drill Down Network PRO
    • Drill Down Waterfall Pro Drill Down Waterfall PRO
    • Drill Down Graph Pro Drill Down Graph PRO
    • Drill Down Timeline Pro Drill Down Timeline PRO
    • Drill Down Combo Bar PRO Drill Down Combo Bar PRO

    Video tutorials

    Watch Now

    More than 90 videos on how to enhance Power BI with ZoomCharts

    Learn more
    All visuals
  • Resources

      Resources

    • Documentation
    • Report Examples
    • Blog
    • Webinars
    • Video Tutorials
    • Visuals Gallery

    Support

    • ZoomCharts Assistance
    • Contact Sales
    • Contact Support
    • FAQ

    Challenges

    Challenges

    Improve your report creation skills by participating in free challenges for report creators.

    Learn more
    Start trial
  • Services
    • Power BI Report Development
    • Custom Visual Development
  • Challenges
  • Pricing
Request a quote Start Free Book a Demo Sign in
Get it now
Go back

Contents

Go back

Share

Logo

Welcome to the Onyx Data May 2025 Challenge!

May 01 - May 29, 2025 | EDT

Build a Power BI report that tells the story of mobile sales across different regions, highlights best-selling products and trends, and helps the business understand customer behavior better.

Timeline

Registration Open

Registration Open

01 May | 07:00

-

Submissions Open

Submissions Open

01 May | 07:00

-

Workshop | How to Create Mobile Sales Power BI Report | Workshop

Workshop | How to Create Mobile Sales Power BI Report | Workshop

14 May | 07:00

-

1:1 Mentoring Sessions

1:1 Mentoring Sessions

14 May | 07:00

01 May - 24 May

Entry Submission Deadline

Entry Submission Deadline

24 May | 18:00

01 May - 24 May

Webinar | See the Top 5 Reports Analyzing Mobile Phone Sales

Webinar | See the Top 5 Reports Analyzing Mobile Phone Sales

29 May | 08:00

01 May - 24 May

Winner Announced

Winner Announced

29 May | 09:00

01 May - 24 May

Dataset

Get the dataset

See past Onyx Data challenges

See past challenges

Share the challenge

Submitted Reports
About challenge
How to participate
The Brief
Judging criteria
Timeline
Dataset
Past challenges

Winner of the challenge

Report Card

Mobile Sales Analysis

Author: Chakradhar Mantena

44

View Report

All Submissions

Report Card

Mobile Analysis

Author: Karim Marzouki

1

View Report
Report Card

Mobile Phone Analysis

Author: Godspower Iheanacho

2

View Report
Report Card

Crystal_MobilePhone_DB

Author: Crystal Andrea Dsouza

3

View Report
Report Card

Mobile phone sales analysis

Author: Noureddine Yachou

0

View Report
Report Card

Mobile Phone Sales Report

Author: Olukayode Akintola-Peters

0

View Report
Report Card

mobile-sales-dashboard

Author: Kalu Okorie

0

View Report
Report Card

phone sales analysis

Author: Azeez Olaribigbe

1

View Report
Report Card

Data DNA May Challenge-Mobile Phone Sales Dataset

Author: Mohammad Imran Jaffrey

0

View Report
Report Card

Mobile Sales Dashboard

Author: Aaisha Aafreen

0

View Report
Report Card

Paziewski_Onyx_May_Challenge

Author: Wojciech Paziewski

0

View Report
Report Card

May 2025 DataDNA – Mobile Phone 2024 Sales Analysis

Author: Shikha Shetty

0

View Report
Report Card

Mobile Sales Analysis

Author: Yuliia Krachun

1

View Report
Report Card

Mobile Sales Dataset

Author: Taha Ali Ansari

0

View Report
Report Card

Mobile Phone Sales Analysis by Mira Flor Salazar

Author: Mira Flor Salazar

1

View Report
Report Card

Mobile Sales Analysis

Author: PRAJNAMITA LODH

0

View Report
Report Card

Mobile Sales Analysis

Author: Kanchan Kulkarni

0

View Report
Report Card

Onyx Data Mini Challenge - May 2025

Author: Mhd. Idris Nasution

0

View Report
Report Card

Mobile Device Analysis

Author: Michael Owusu Agyebeng

0

View Report
Report Card

Mobile Sales & Trends Analysis

Author: Surekha Berlin

0

View Report
Report Card

Mobile sales analysis

Author: Houssam Damerji

0

View Report
Report Card

Mobile Phone Sales Analysis

Author: Ugochukwu Nwasuruba

1

View Report
Report Card

Mobile-Phone-Sales-Dataset-May-2025 Report.pbix

Author: Ayuba Ahmed Bayugo

0

View Report
Report Card

Rami Kassiar

Author: Rami Kassiar

0

View Report
Report Card

Hugo Lopes

Author: Hugo Lopes

0

View Report
Report Card

May 2025 onyx

Author: Adediran Adeyemi

1

View Report
Report Card

Onyx Data May 2025 Challenge

Author: Keerthan Poojary

1

View Report
Report Card

Mobile Sales Analysis

Author: Akashdeep Dam

0

View Report
Report Card

Mobile Phone Sales Analysis

Author: David Amri

0

View Report
Report Card

Mobile Sales Data

Author: Steven Stanford

0

View Report
Report Card

Mobile Sales Dashboard

Author: Pritam Tungare

0

View Report
Report Card

Mobile Sales Analysis

Author: Nkechi Alexander

1

View Report
Report Card

Mobile Phone Sales Analysis

Author: Bidemi Saka

1

View Report
Report Card

onyx_data_challenge2

Author: sanju yadav

0

View Report
Report Card

Rami Kassiar

Author: Rami Kassiar

0

View Report
Report Card

Mobile Sales Report

Author: Chidera Lindy Ozoh

0

View Report
Report Card

Smart Phone Sales Analysis

Author: Okeh Dono Efasa

0

View Report
Report Card

Mobile phone sales submission

Author: Ngoan Do

0

View Report
Report Card

Mobile Sales Dashboard

Author: Rakshit Bhadoria

0

View Report
Report Card

Maria Diaz- OnyxDataChallengeMay2025-MobilePhone

Author: Maria Diaz

0

View Report
Report Card

Mobile Phone Sales Data Set Report

Author: Kyawmoewaingp Wai

0

View Report
Report Card

Phone sales Analysis

Author: christopher Enukoha

1

View Report
Report Card

Deepak Mathew

Author: Deepak Mathew

0

View Report
Report Card

Mobile_Sales_Onyx_challenge

Author: Swaroopa Mummadi

0

View Report
Report Card

Onyx Mobile Report

Author: Bhimashankar Shinde

0

View Report
Report Card

2024 Mobile Sales Analysis with Power BI by Idowu Akinwale

Author: Idowu Akinwale

0

View Report
Report Card

Mobile Phone Analysis

Author: Muthu Krishnan

0

View Report
Report Card

Mobile Phone Sales

Author: Gori Omotola

0

View Report
Report Card

Mobile Sales Dashboard

Author: Mar Lar Than

0

View Report
Report Card

Mobile Sales Analysis

Author: Shubham Gadekar

0

View Report
Report Card

Mobile Phone Sales

Author: Agbata Dickson Ukolojo

25

View Report
Report Card

Mobile Sales

Author: Chandrakant Jadhav

0

View Report
Report Card

Mobile Sales Report Dashboard

Author: Blessing Umoh

0

View Report
Report Card

Mobile Market Performance

Author: Teresa Cazarin

1

View Report
Report Card

Mobile Phone Sale Analysis

Author: Htoo Htet Oo

0

View Report
Report Card

Mobile Sales

Author: Sergio Lazaro

0

View Report
Report Card

Peter Odesola

Author: Peter Odesola

0

View Report
Report Card

Mobile Sales Analysis 2024

Author: Lisa Ifunanya Onwusulu

0

View Report
Report Card

Mobile Sales Analysis

Author: Ajinkya Sahasrabudhe

0

View Report
Report Card

Mobile Sales

Author: Mohammed Nabel

1

View Report
Report Card

Dynamics Phone Retail Multi-user Dashboard

Author: Eniola Adejori

0

View Report
Report Card

Mobile Sales Analysis

Author: Yew Kok Tang

0

View Report
Report Card

Mobile Phone Sales Analysis

Author: Ogungbile Marvelous

0

View Report
Report Card

Mobile Sales Analysis

Author: CHAWKI HAZAM

0

View Report
Report Card

Mobile Sales Analysis

Author: Mohamed Omari

0

View Report
Report Card

Mobile Sales Analysis

Author: Sampath Kumar K

0

View Report
Report Card

Mobile Sales Analysis

Author: Darwin Obeal

0

View Report
Report Card

Mobile Phone Sales

Author: Jude Raji

44

View Report
Report Card

Onyx Data Challenge - Mobile Sales Analysis

Author: Pherzy John Diez

32

View Report
Report Card

Mobile Phone Sales

Author: Itiksha Mittal

33

View Report
Report Card

Mobile Phone Sales Report

Author: Sai Krishna Tummidi

19

View Report
Report Card

Mobile Sales Analysis

Author: Misha Riaz

37

View Report
Report Card

Mobile Sales Dashboard

Author: Danish Sayyed

14

View Report

About ZoomCharts Mini Challenge

ZoomCharts Mini Challenge is part of the global DataDNA – Dataset Challenge by Onyx Data, which unites 25K+ data enthusiasts worldwide, ranging from beginners to seasoned professionals, including Microsoft MVPs. Read more about the DataDNA challenge on the Onyx Data website. Join the community on LinkedIn

The ZoomCharts Mini Challenge provides a platform for a growing community to learn how to build PRO reports, aiding business users to explore data quickly and intuitively.

  1. Free License: All participants receive a free ZoomCharts Developer License that gives access to the full Drill Down PRO visuals library. License will remain active for 1 year after the challenge.
  2. Learn from Experienced Professionals: As part of the challenge, we host live workshops on report building and visualizing the challenge’s dataset in Power BI. Challenge participants can also book an individual consultation with an experienced Power BI mentor to ask questions and get personalized tips.
  3. Tailored Feedback: Every challenge submission will receive personalized feedback, giving participants the chance to hone their skills and improve their reports.

Prizes

The best report’s creator will receive a $300 Amazon gift card from ZoomCharts.

Upcoming webinars

Recording thumbnail

See the Top 5 Reports Analyzing Mobile Phone Sales

29th May, 2025

08:00 AM - EDT

Join us live as we review the top Power BI dashboards from the Mobile Sales & Trends Analysis Challenge!

Learn more

Webinar recordings

Recording thumbnail

How to Create Mobile Sales Power BI Report | Workshop

Power BI workshop using mobile sales dataset. Get ready for the May DataDNA Challenge with practical tips and report ideas.

Watch the recording

How to participate? 

1. Register for the challenge: 

  • Register for DataDNA ZoomCharts Mini Challenge using the form above ⬆️
  • Activate your free Drill Down Visuals Developer License for Power BI. Read license setup instructions.
  • Download Challenge dataset from Onyx Data DataDNA website.

2. Build your report in Power BI: 

  • Set up an account in Power BI using the assigned license details (if you have participated in ZoomCharts Challenges in the past, you can use the same account you set up before).
  • Use the account to access the full library of custom ZoomCharts Drill Down visuals. 
  • Use the dataset to build a Power BI report including at least 2 ZoomCharts Drill Down Visuals in one report page. 

3. Improve your report and learn new skills: 

  • To learn more about applying ZoomCharts visuals in your reports, participate in the challenge workshop. 
  • If you have any questions or need advice, you can book a free individual consultation here.
  • Check out the submissions from past challenges for inspiration. 

4. Submit your challenge entry: 

  • Submit your report in .pbix format for validation using the form on this challenge page.

If your submission doesn’t match the challenge criteria, you will be notified by email indicating the reason. Don't worry if this happens! You can fix the issue and resubmit your report. 

  • Your report will be reviewed within 1–2 business days. Once it’s validated, you’ll receive a Publish to Web link via email. You can use this link to add the report to your portfolio or share it publicly online.
  • All validated entries will also receive personalized feedback from the evaluation team via email within 1-2 business days. Use this feedback to revise your report and resubmit it before the deadline.

Note: Feel free to resubmit your entry as many times as necessary before the deadline.

5. Finalize your participation to compete for the prize

  • Post the final version of your submission as a single image on your LinkedIn profile, including the tags @ZoomCharts and @OnyxData, as well as the hashtags #dataDNA and #builtwithzoomcharts.
  • After posting the report on LinkedIn, please submit it to the Onyx Data DataDNA Main Challenge
  • Follow ZoomCharts on LinkedIn 
  • Follow Onyx Data on LinkedIn 
  • All participants of ZoomCharts Mini Challenge need to submit reports main Onyx Data DataDNA challenge for a chance to win additional prizes.

6. Attend challenge closing webinar to hear the results: 

  • The submissions are evaluated by ZoomCharts team (see "Judging criteria" for more info). The submissions of Top 5 ZoomCharts Mini Challenge finalists are analyzed live during the challenge closing webinar to share the best practices and learning opportunities with the community.
  • The author of the best report is rewarded with a $300 Amazon gift card from ZoomCharts. 

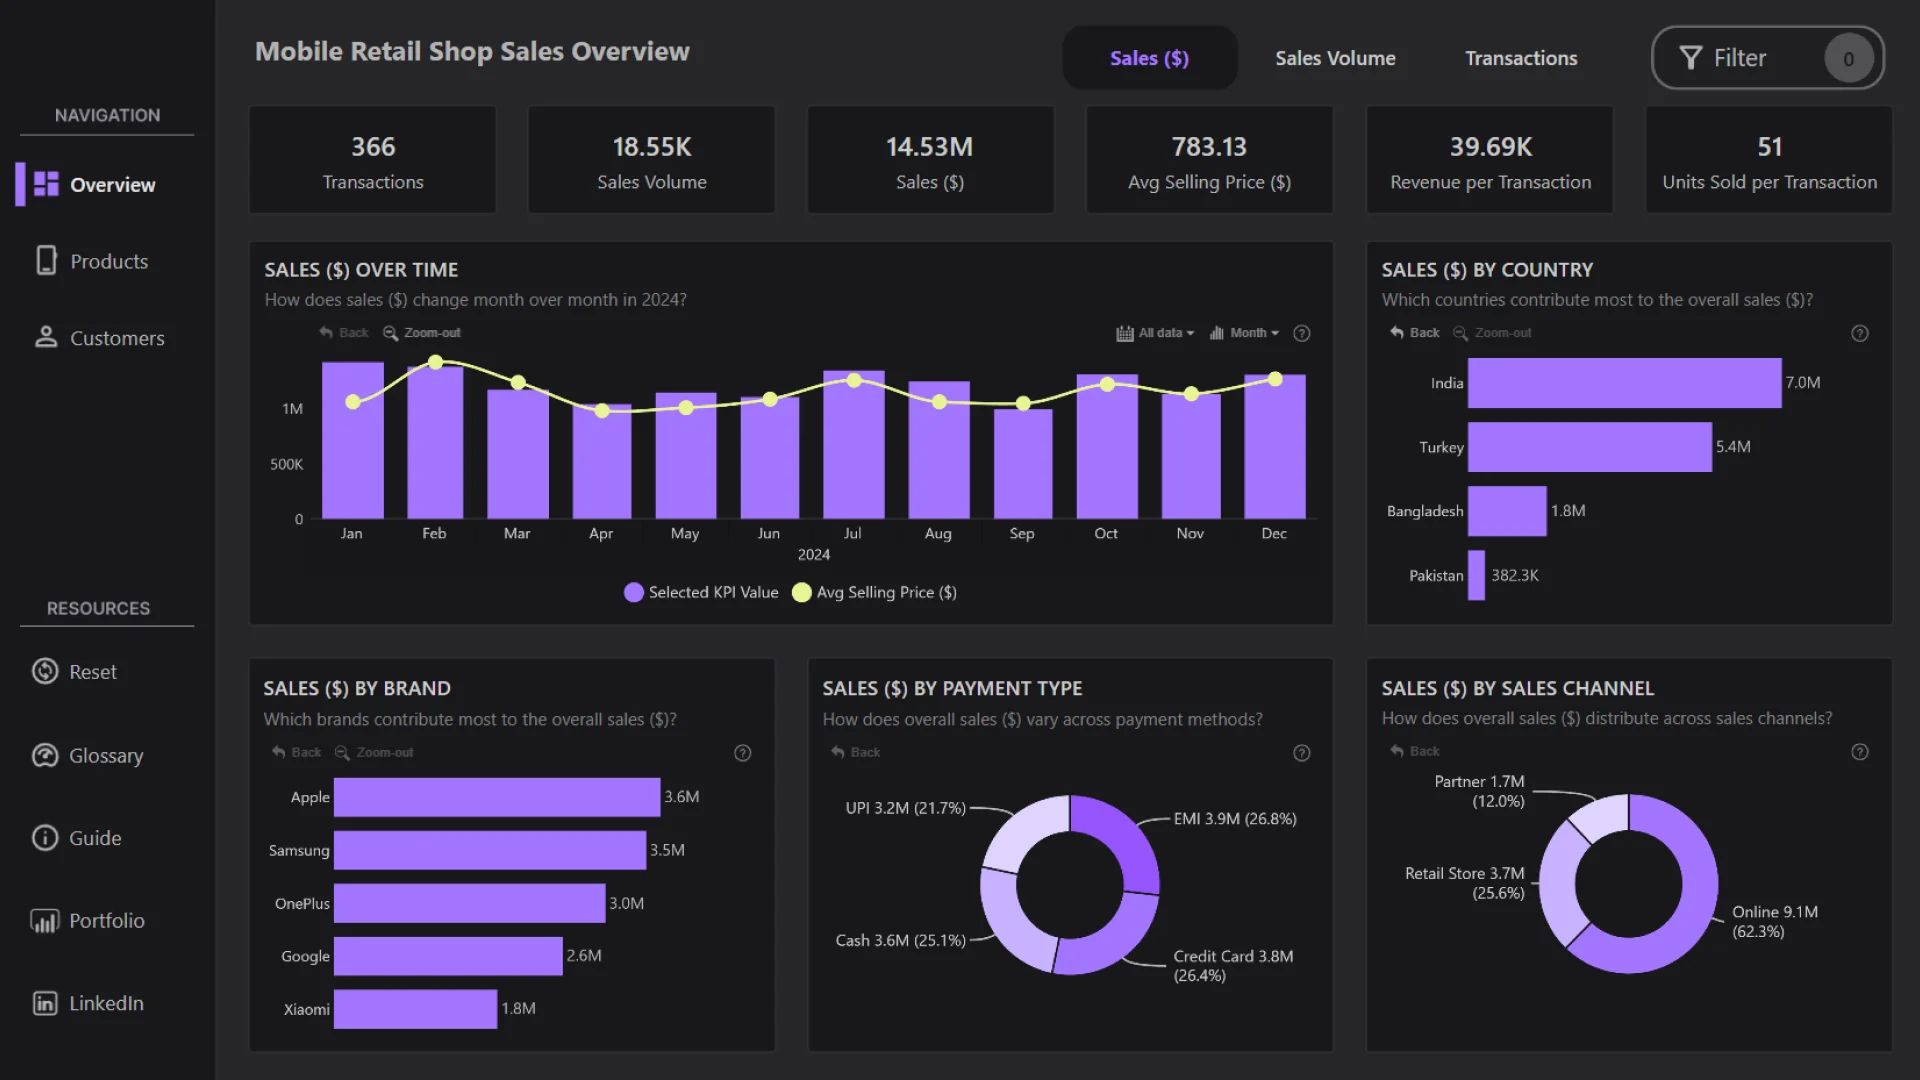
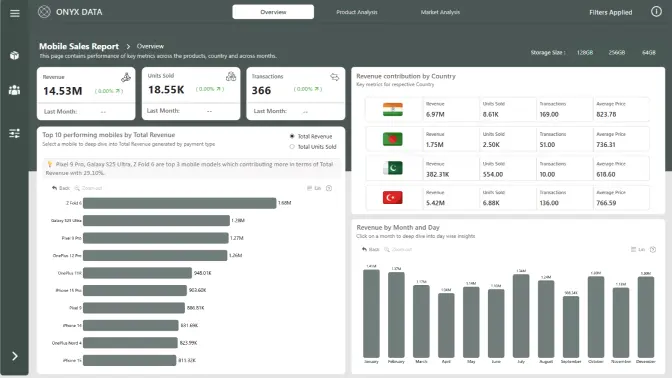
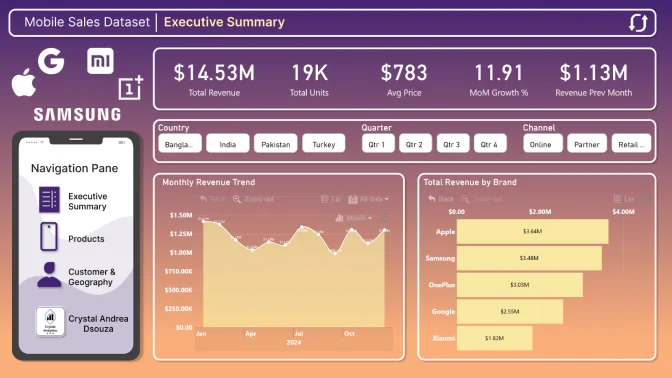
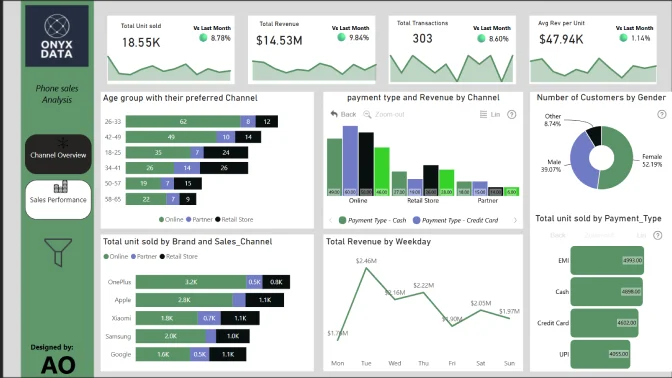
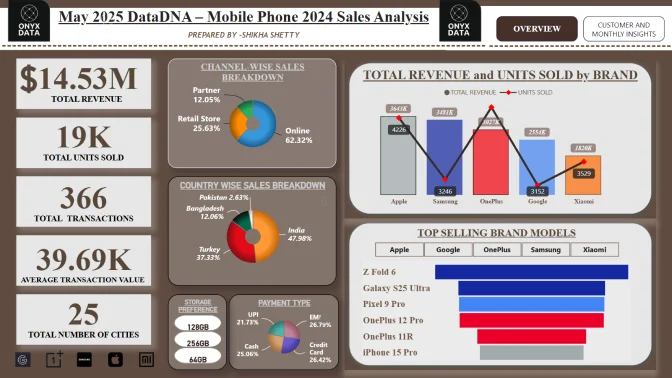
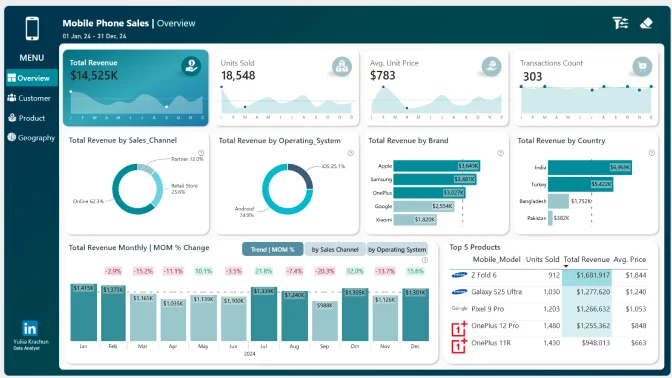
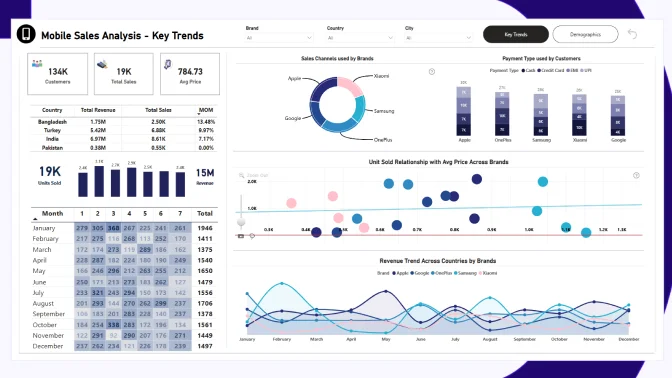
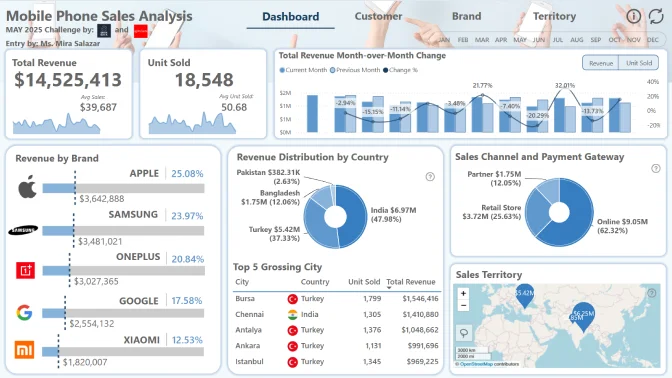
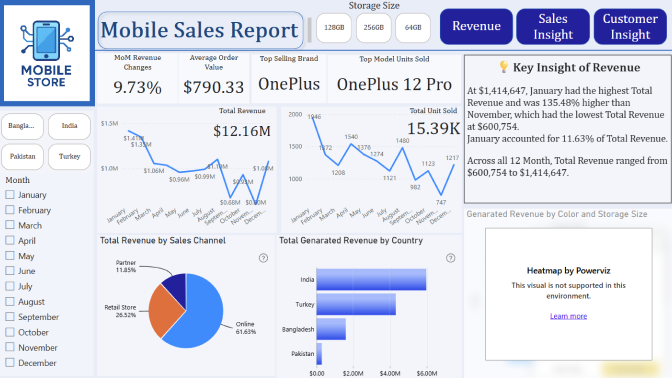
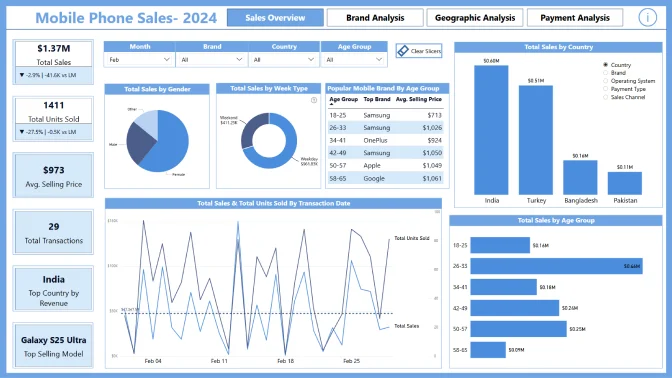
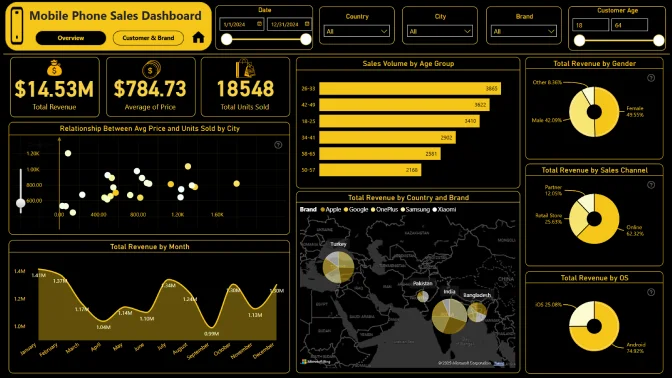
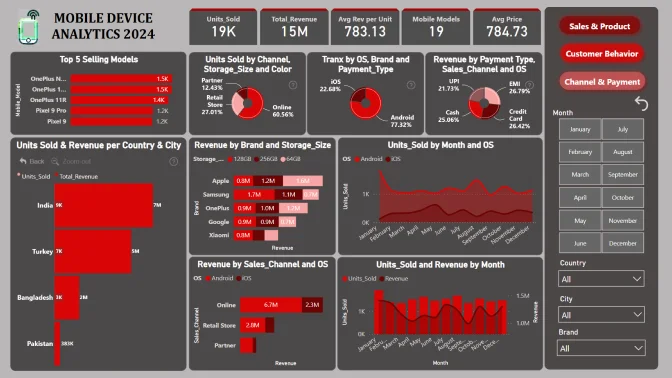
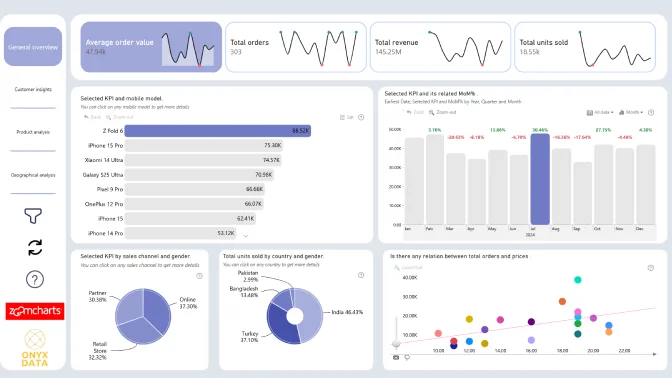
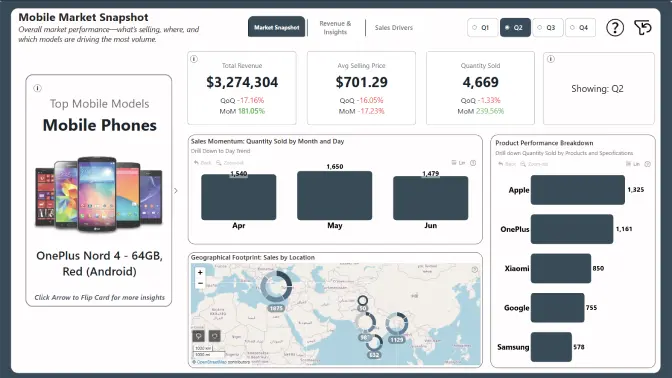
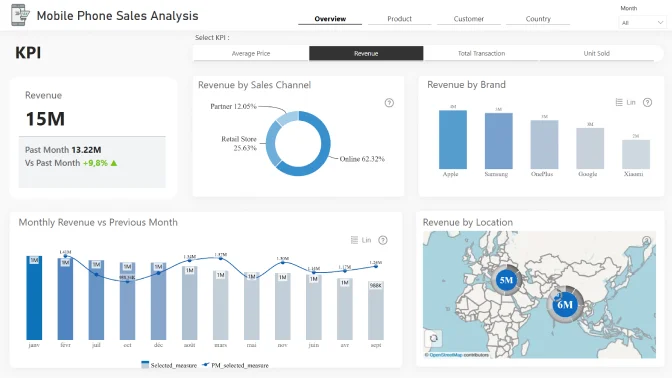
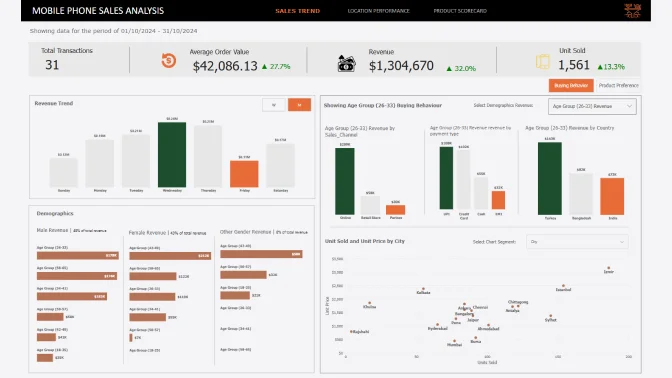
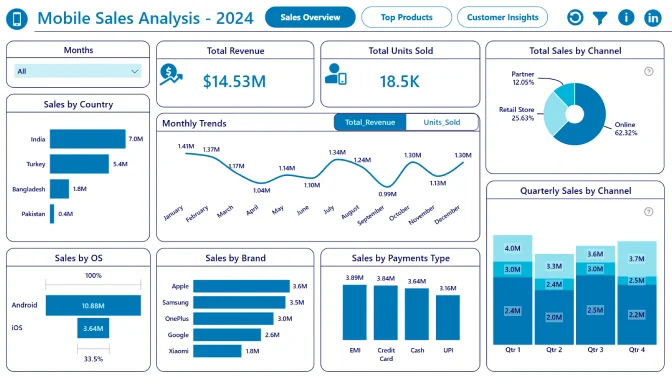
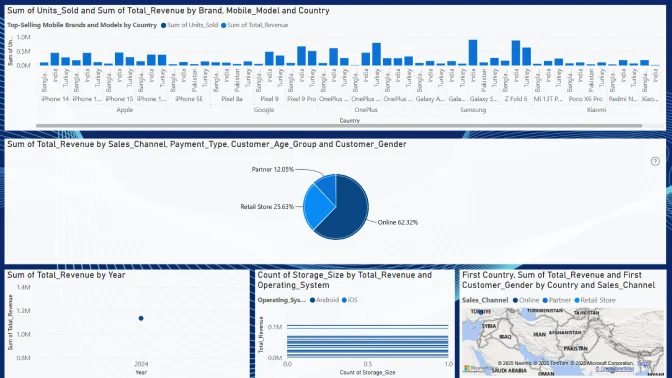
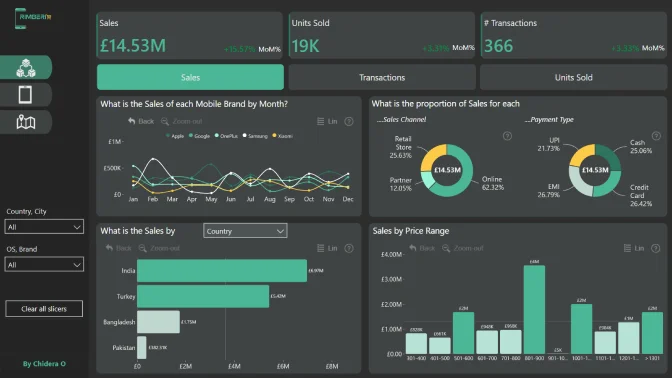
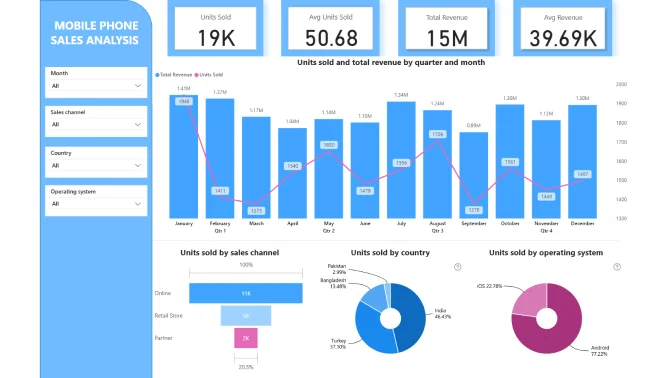
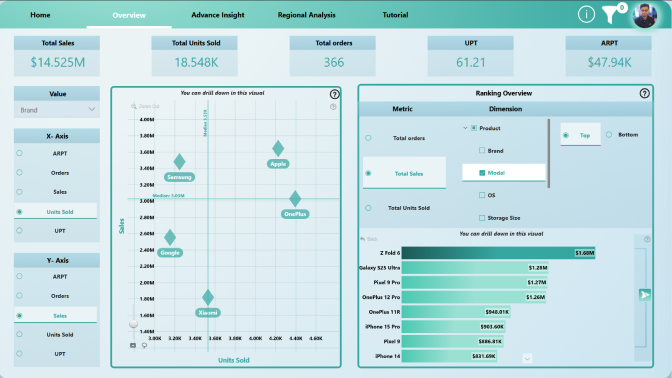
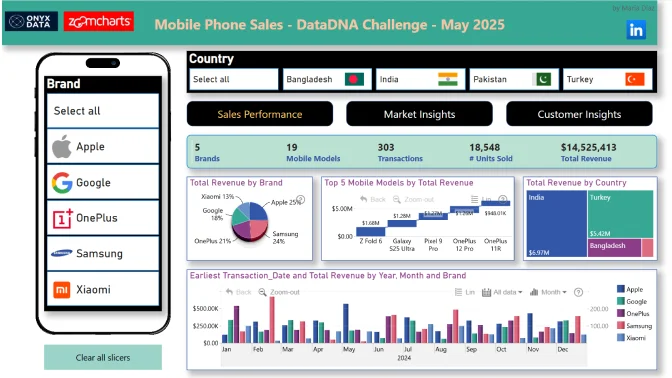
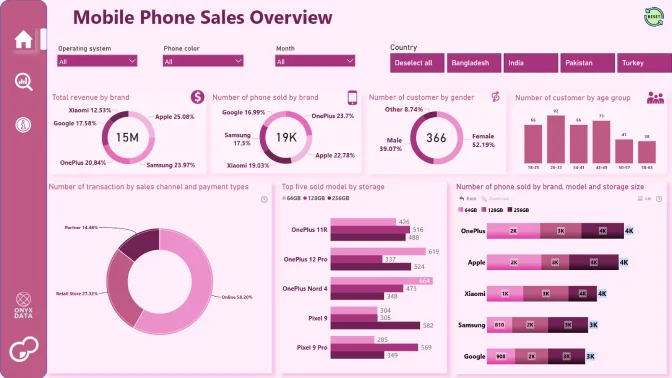
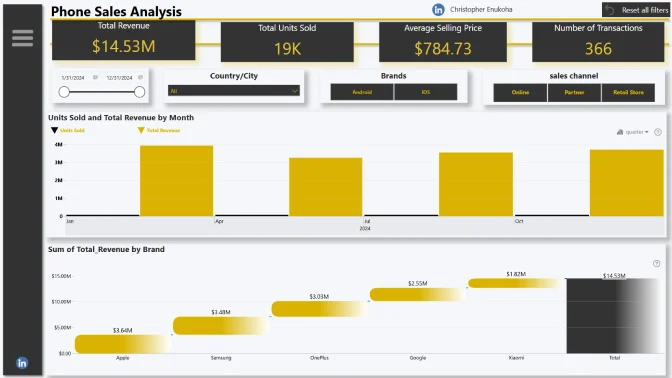
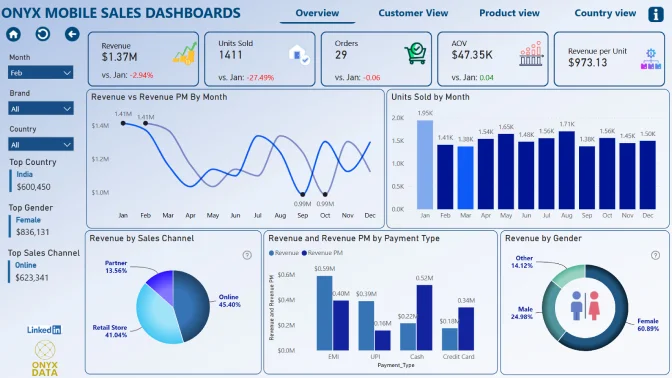
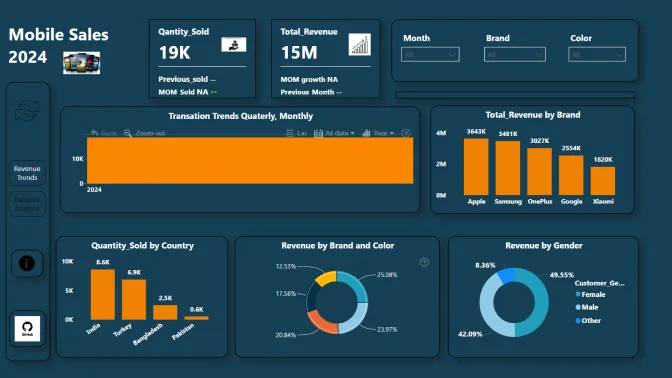
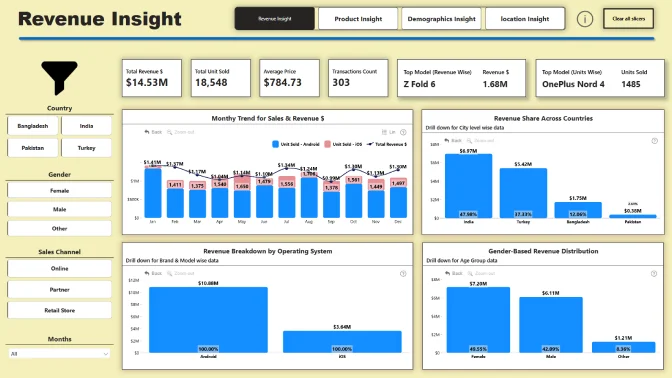
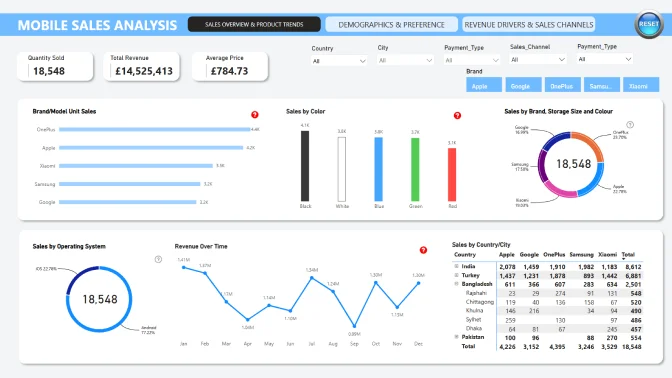
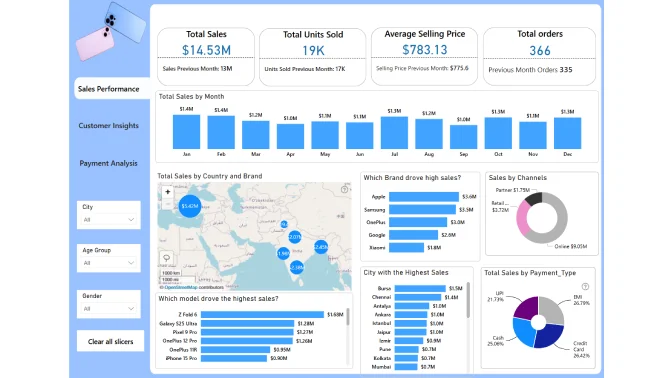
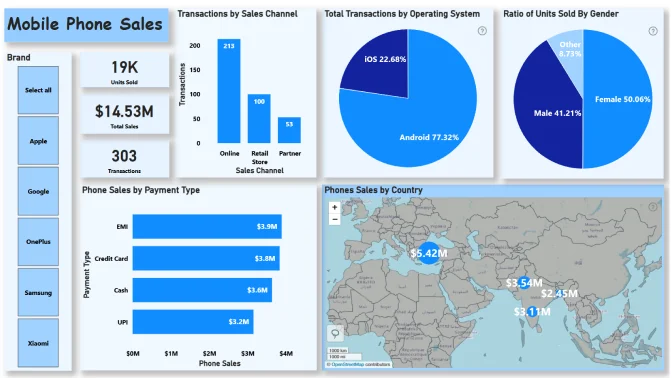
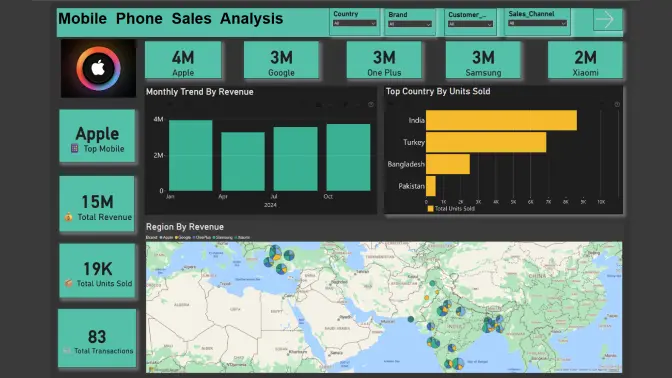
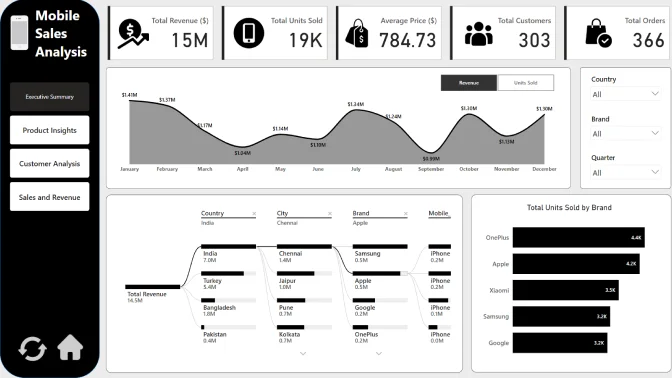
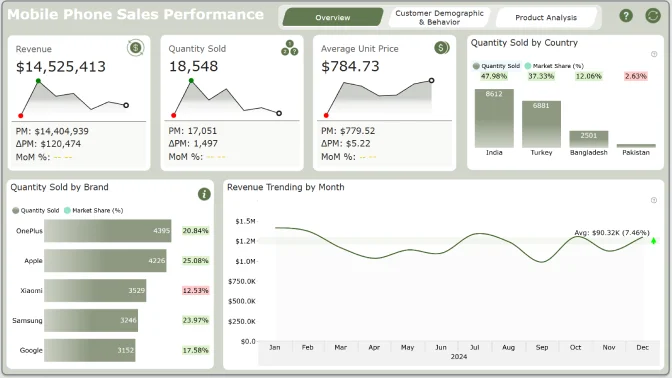
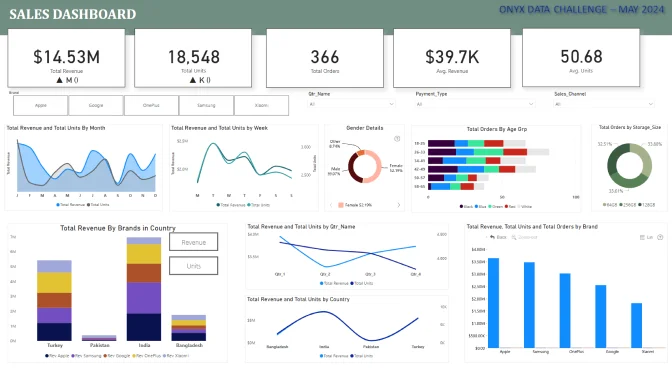
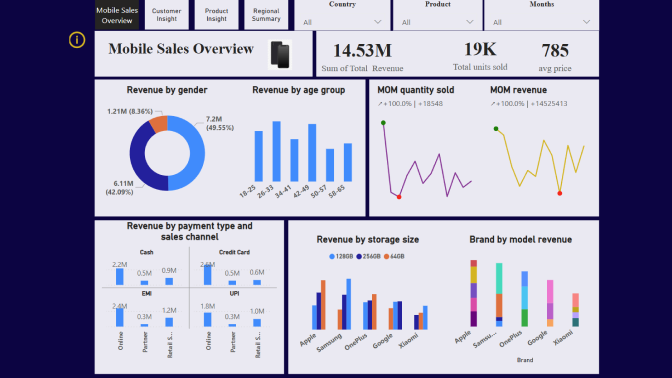
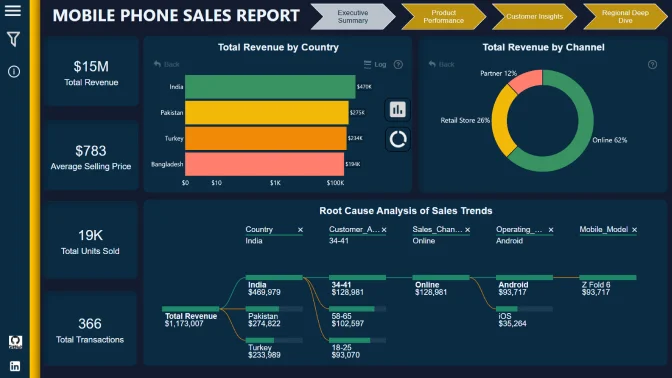
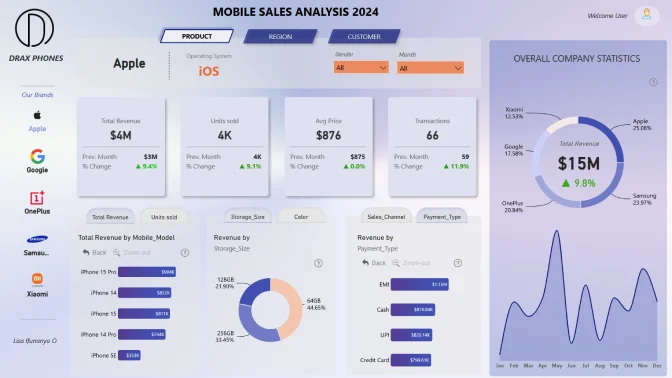
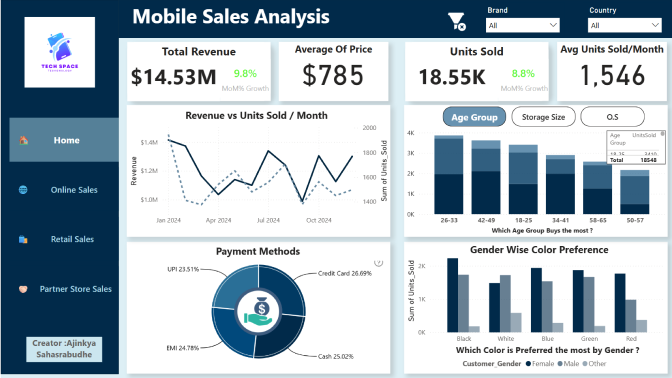
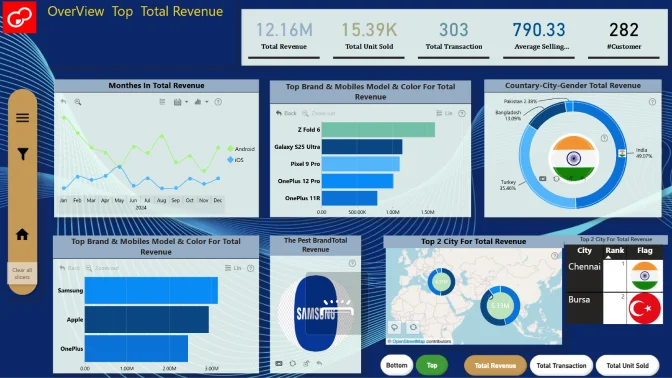
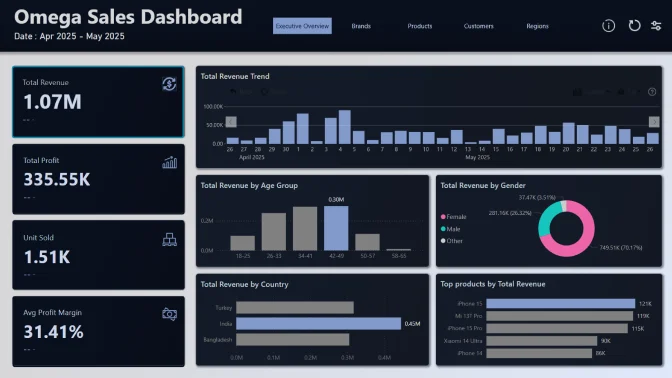
Welcome to the Mobile Sales & Trends Analysis Challenge!

Pretend you are a data analyst for a major mobile phone retailer operating across multiple countries.
You’ve been given a 2024 sales dataset, containing detailed records of mobile phone transactions, customer demographics, product specifications, and geographic locations.


The dataset combines information about the models sold, their prices, storage sizes, colors, operating systems, and customer demographics like age group and gender. It also captures where and how the sales were made – online, through partners, or in-store, and the type of payment used.

Your goal is to build a report that tells the story of mobile sales across different regions, highlights best-selling products and trends, and helps the business understand customer behavior better.

Key questions to answer in your analysis:
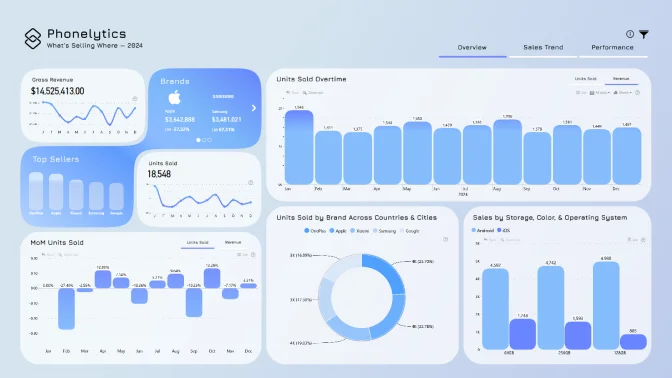
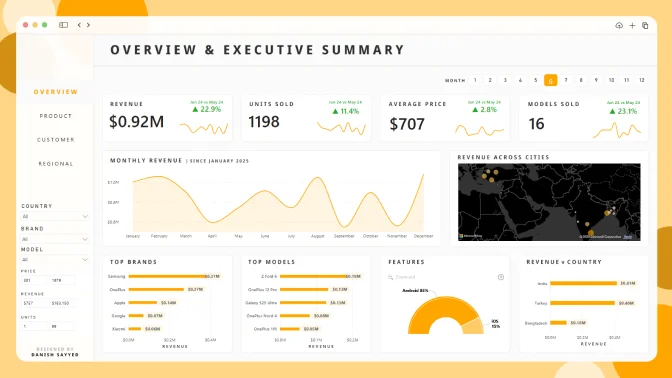
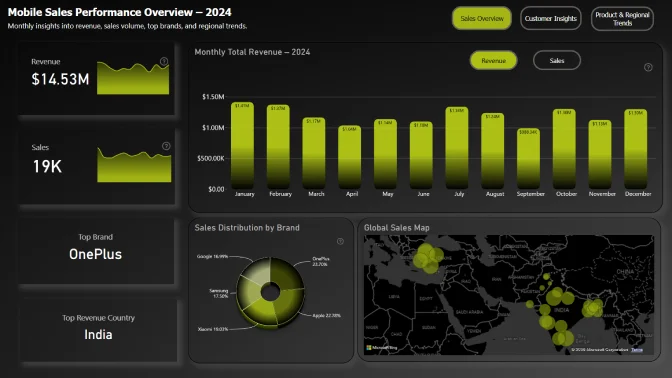
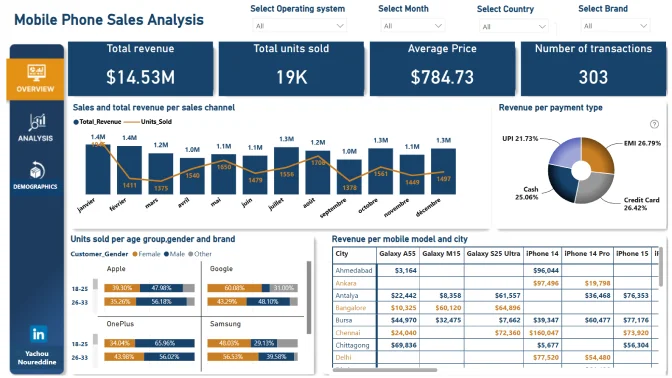
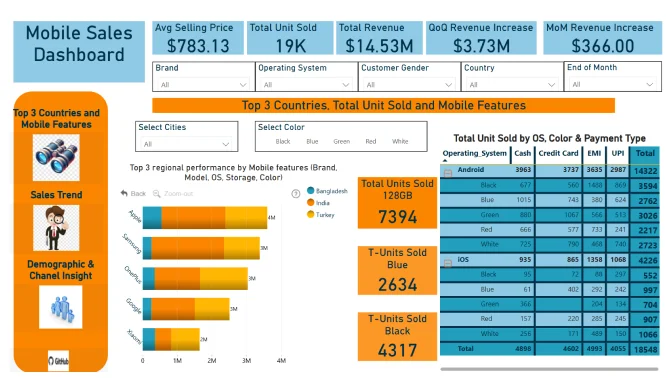
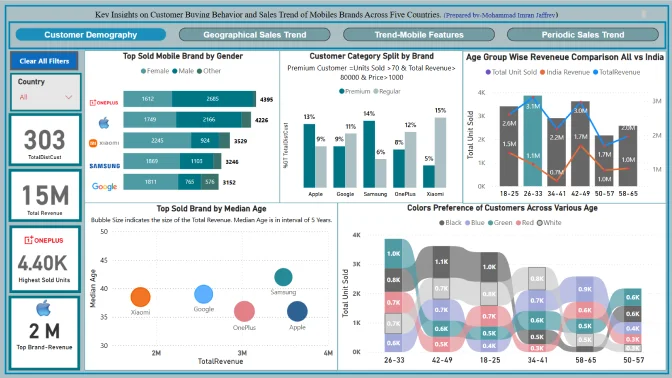
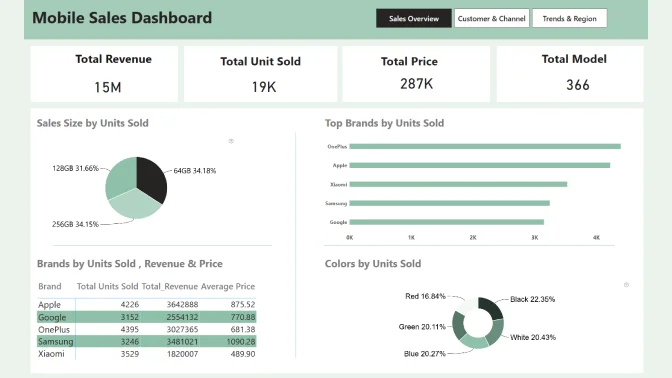
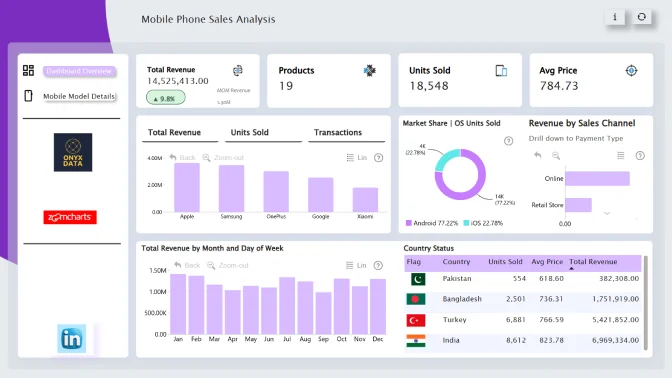
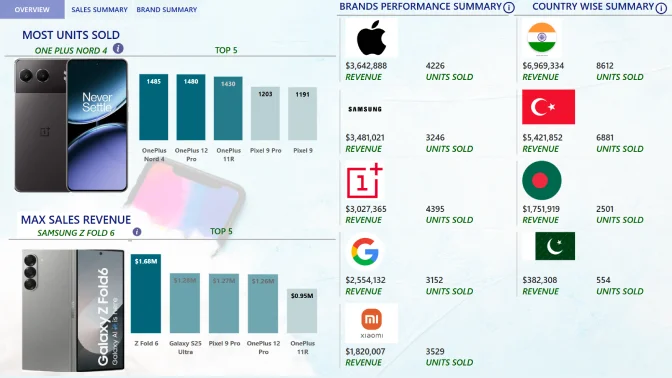
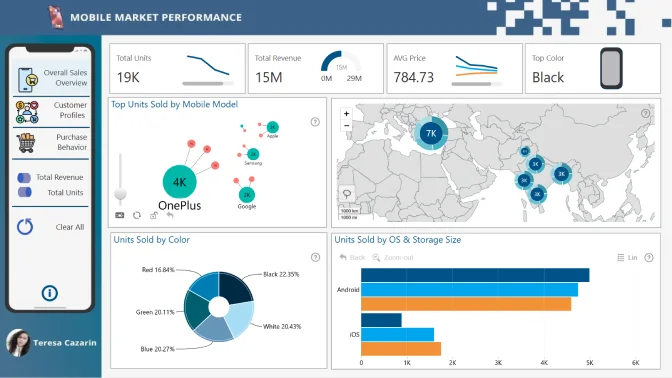
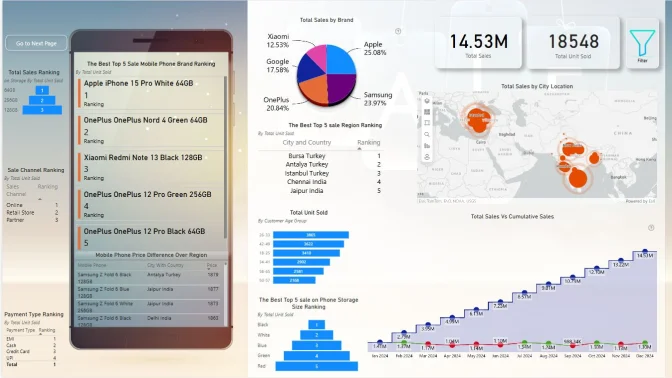
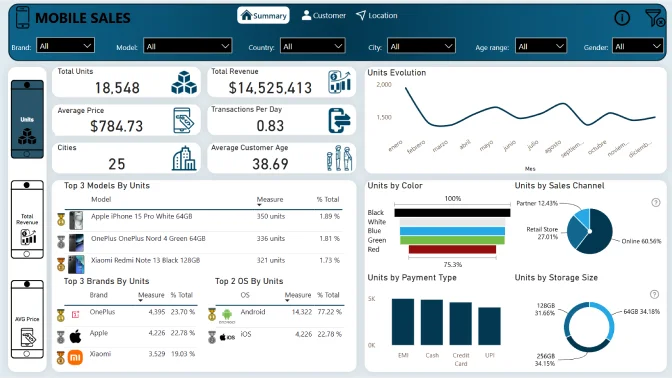
  • Which mobile brands and models are the top sellers overall and in specific countries or cities?
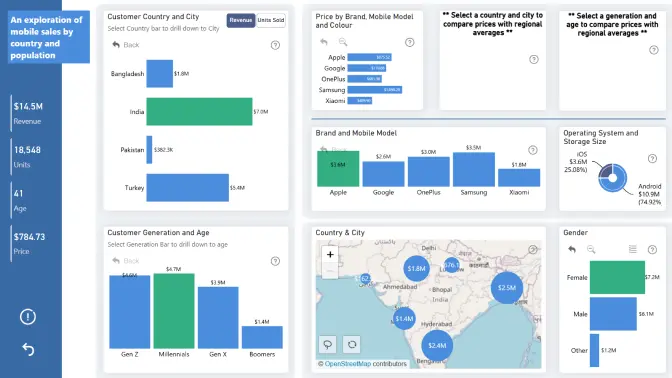
  • How do sales numbers vary by storage size, color, or operating system (Android vs. iOS)?
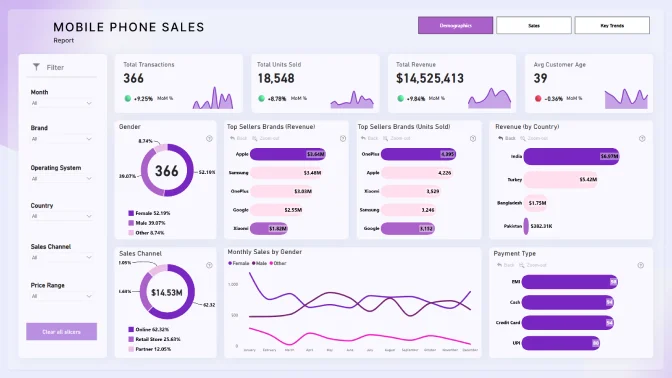
  • What is the typical customer profile — age group, gender — for different brands or models?
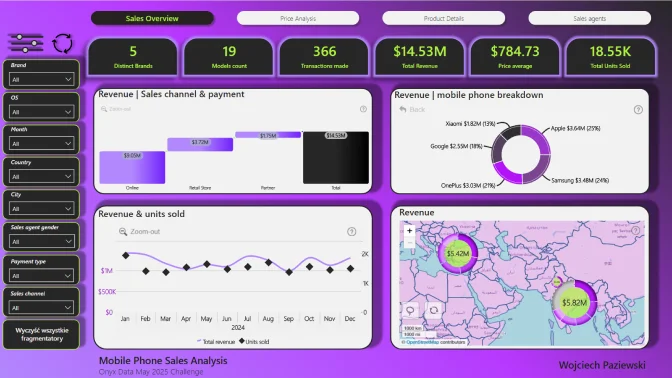
  • How do sales and revenues break down across different sales channels (online, partner, in-store) and payment types?
  • Are there noticeable differences in pricing and sales volume between regions or cities?
  • Which countries or cities generate the highest total revenue and units sold?
  • Are there patterns in customer demographics based on mobile brand, model, or price range?
  • How does sales performance change month over month in 2024?
  • Are there correlations between customer age groups and the type of devices they purchase (for example, younger customers preferring certain brands)?
The questions above are provided to guide your exploration but are not mandatory. Feel free to shape your analysis based on the story you want to tell.


Technical requirements

  • Build your report using only Power BI
  • The number of pages in the report is not limited
  • At least one report page has to contain a minimum of 2 ZoomCharts Drill Down Visuals. See a practical guide on Drill Down Visuals here


Judging criteria

Each report is evaluated based on three main criteria: intuitiveness, insightfulness, and interactivity. These factors ensure that the reports are not only accurate and functional, but also meet the target audience's needs and are ready to be presented to the end-users. 

  1. Intuitive: How clear and easy it is to understand the report at a glance? (max 15 points)
    • Is the report visually appealing?
    • Choice of charts and visual elements
    • Does the report tell a story?
    • Is it not overwhelming to the user?
    • Choice of tooltips, titles, and legends

  2. Interactive: How engaging and seamless is the report exploration and interaction with data? (max 15 points)
    • Clear navigation that allows user to explore the report
    • Use of slicers and other interactive elements
    • Smooth cross-chart integration
    • Is report optimized for touch devices?
    • Are tutorials and guiding elements helpful to the user?

  3. Insightful: How accurate, complete, and meaningful is the data in driving decisions? (max 15 points)
    • Depth of analysis
    • Data cleaning and preparation
    • Does data show up accurately in the report?
    • Is report optimized for quicker loading time?
    • Does the report provide deeper exploration of data (drill-down)?

Timeline

Registration Open

Registration Open

01 May | 07:00

-

Submissions Open

Submissions Open

01 May | 07:00

-

Workshop | How to Create Mobile Sales Power BI Report | Workshop

Workshop | How to Create Mobile Sales Power BI Report | Workshop

14 May | 07:00

-

1:1 Mentoring Sessions

1:1 Mentoring Sessions

14 May | 07:00

01 May - 24 May

Entry Submission Deadline

Entry Submission Deadline

24 May | 18:00

01 May - 24 May

Webinar | See the Top 5 Reports Analyzing Mobile Phone Sales

Webinar | See the Top 5 Reports Analyzing Mobile Phone Sales

29 May | 08:00

01 May - 24 May

Winner Announced

Winner Announced

29 May | 09:00

01 May - 24 May

Dataset

Get the dataset

See past Onyx Data May 2025 challenges

See past challenges

Your Drill Down Visuals Developers License

Use the email and password provided below to log in Power BI Desktop and access an account with a license to use all ZoomCharts Drill Down Visuals.

Upon logging in, you will need to change your password and enable two-factor authentication. If you encounter any problems, feel free to reach out to us via chat.

*This Developer License can be used to create a report for this ZoomCharts Mini Challenge or for your personal training purposes. Commercial use of this license is prohibited.

Upload failed
Attach file
File requirements: 16MB

Any questions? Feel free to use chat!

Are you sure you want to delete the report?

Activate your Drill Down visuals Developer License!

You can use these credential to access ZoomCharts visuals and create your report for this ZoomCharts Mini Challenge, or for your personal training purposes.


logo
[email protected]
+44 204 577 3993
logo

Products

Drill Down Network PRO Drill Down Waterfall PRO Drill Down Graph PRO Drill Down Combo PRO Drill Down Combo Bar PRO Drill Down Donut PRO Drill Down Pie PRO Drill Down TimeSeries PRO Drill Down Timeline PRO Drill Down Map PRO Drill Down Scatter PRO All Visuals

Resources

Report Examples Webinars Blog ZoomCharts Academy Visuals Gallery Documentation Custom Visual Development Subscribe to News

Solutions

Custom Visual Development

Company

Pricing About Us Partners Leave feedback Join PowerGroup EU Funding

Help

ZoomCharts Assistance Contact Sales Contact Support FAQ

Drill Down Network PRO Drill Down Waterfall PRO Drill Down Graph PRO Drill Down Combo PRO Drill Down Combo Bar PRO Drill Down Donut PRO Drill Down Pie PRO Drill Down TimeSeries PRO Drill Down Timeline PRO Drill Down Map PRO Drill Down Scatter PRO All Visuals

Report Examples Webinars Blog ZoomCharts Academy Visuals Gallery Documentation Custom Visual Development Subscribe to News

Custom Visual Development

Pricing About Us Partners Leave feedback Join PowerGroup EU Funding

ZoomCharts Assistance Contact Sales Contact Support FAQ
+44 204 577 3993
[email protected]

Ready to get in touch?

Contact our experts with any question about Power BI and ZoomCharts for Free!

Contact us

© 2025, Data Visualization Software Lab

U.S. Patents No. 11,645,343; 11,921,804

Cookies Policy
Manage cookies
Privacy Policy
Global
EULA
Patent
warning

Error message

success

Success info: Done!

ZoomCharts AI Assistant

We noticed you're using an old OS version.

For the best experience, we recommend upgrading to ensure that all website features display correctly.

Cookie settings

We use necessary cookies for site functionality, as well as statistic, marketing, and preference cookies to enhance your experience. For more information and to manage your preferences, please visit our Cookie policy